

These are the cities with the most air pollution in the United States
One state had 6 in the top 20
Are you living in one of the most polluted cities in America? The United States seems as if its air is relatively pollution-free but there are areas all around the nation suffering from very high concentrations of small particulate matter.
The State of the Air Report
Visual Capitalist used data from the American Lung Association’s 2024 ‘State of the Air’ report to rank the most polluted cities in America by their annual average PM2.5. Before we look at the cities, there are a few things to know.
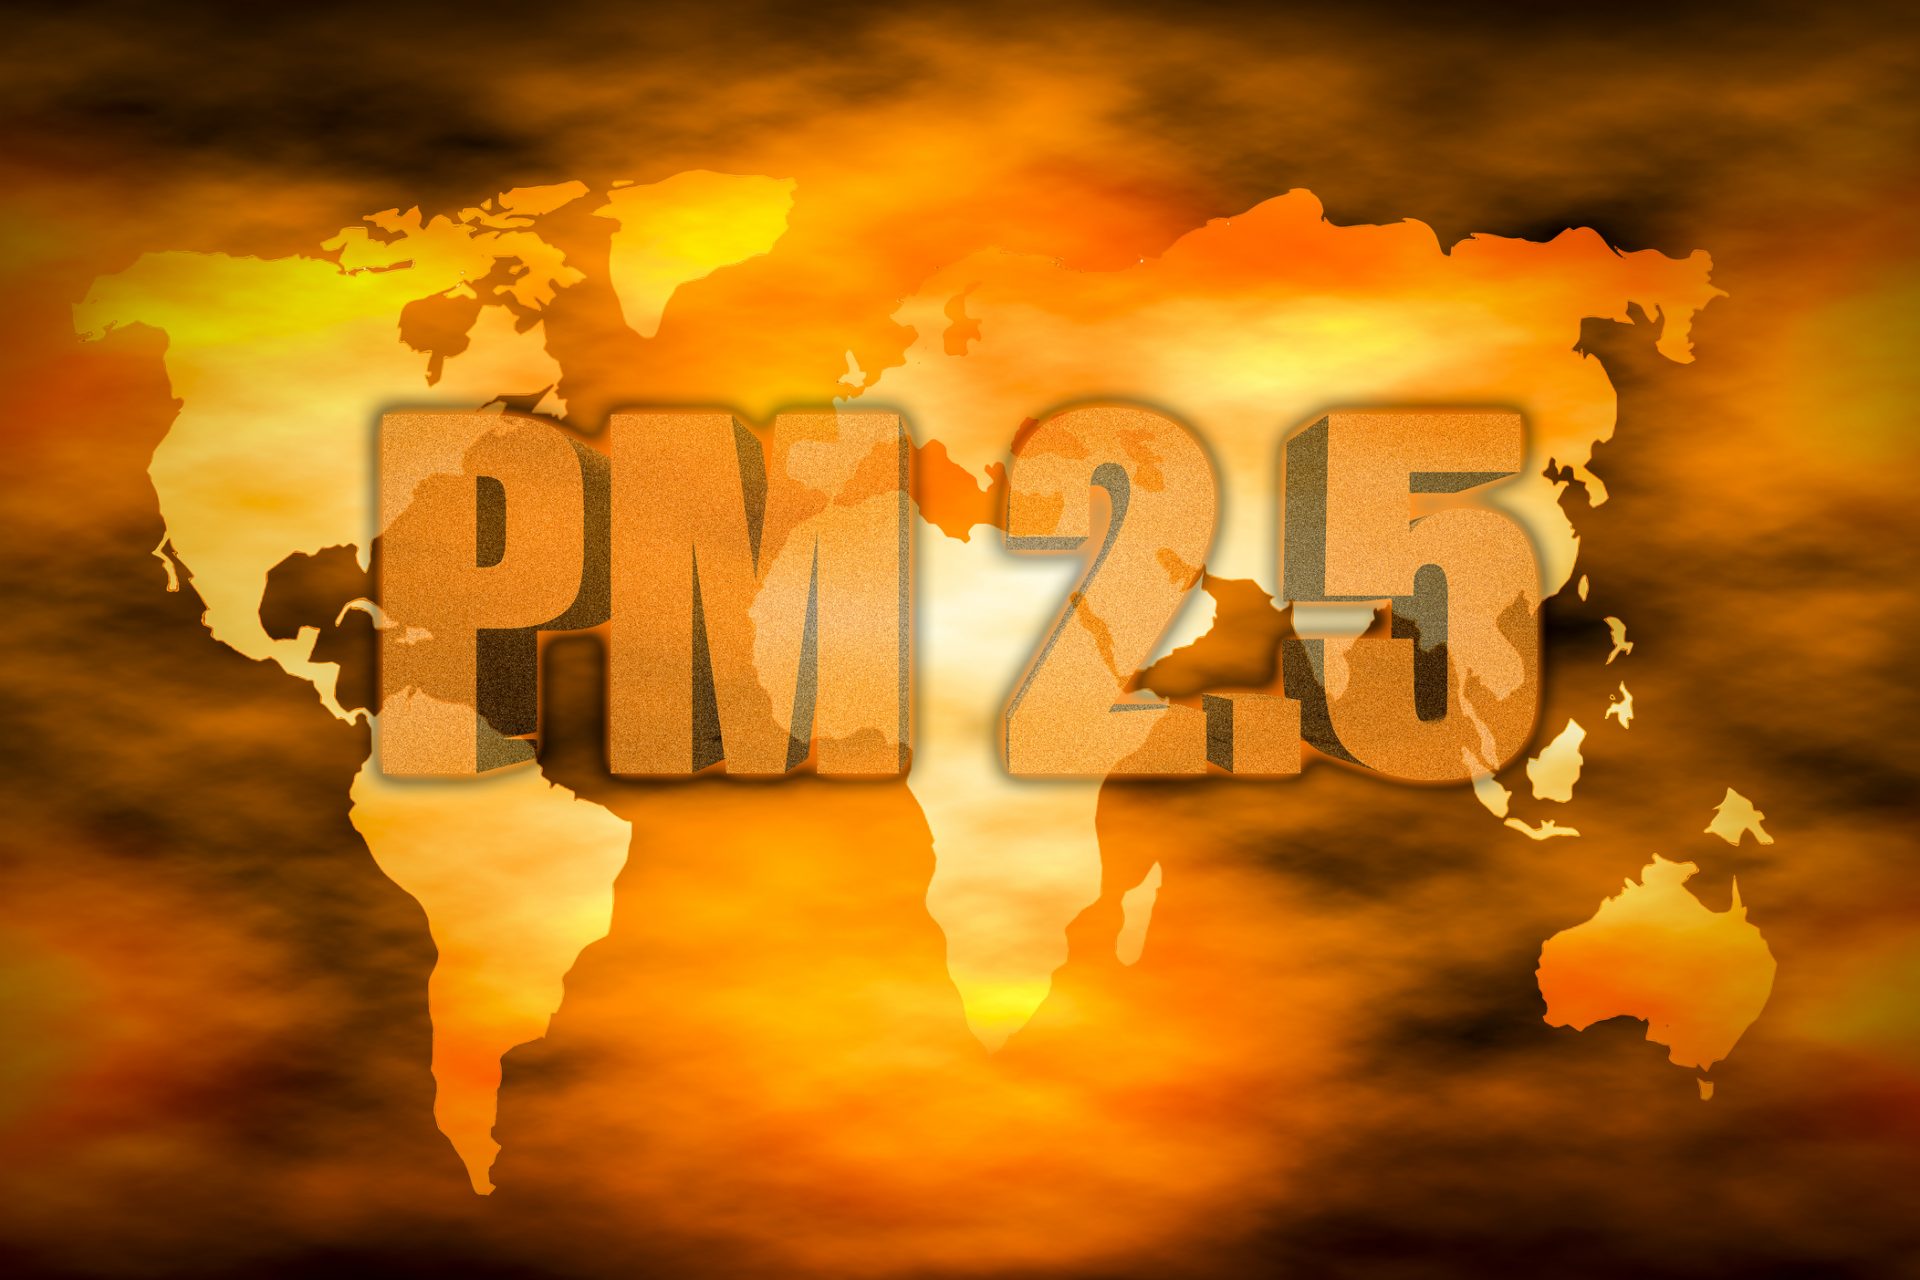
What does PM2.5 mean?
PM2.5 refers to particulate pollution from fine particles according to the New York State Department of Health. High levels of PM2.5 in the air can be very unhealthy and lead to problems like heart disease, asthma, and birth issues.
The silent killer
McGill University called PM2.5 “a silent killer” following a study its scientists conducted in 2022 that found that PM2.5 pollution is responsible for 4.2 million premature deaths around the world, over 50,000 of which occur in the U.S.
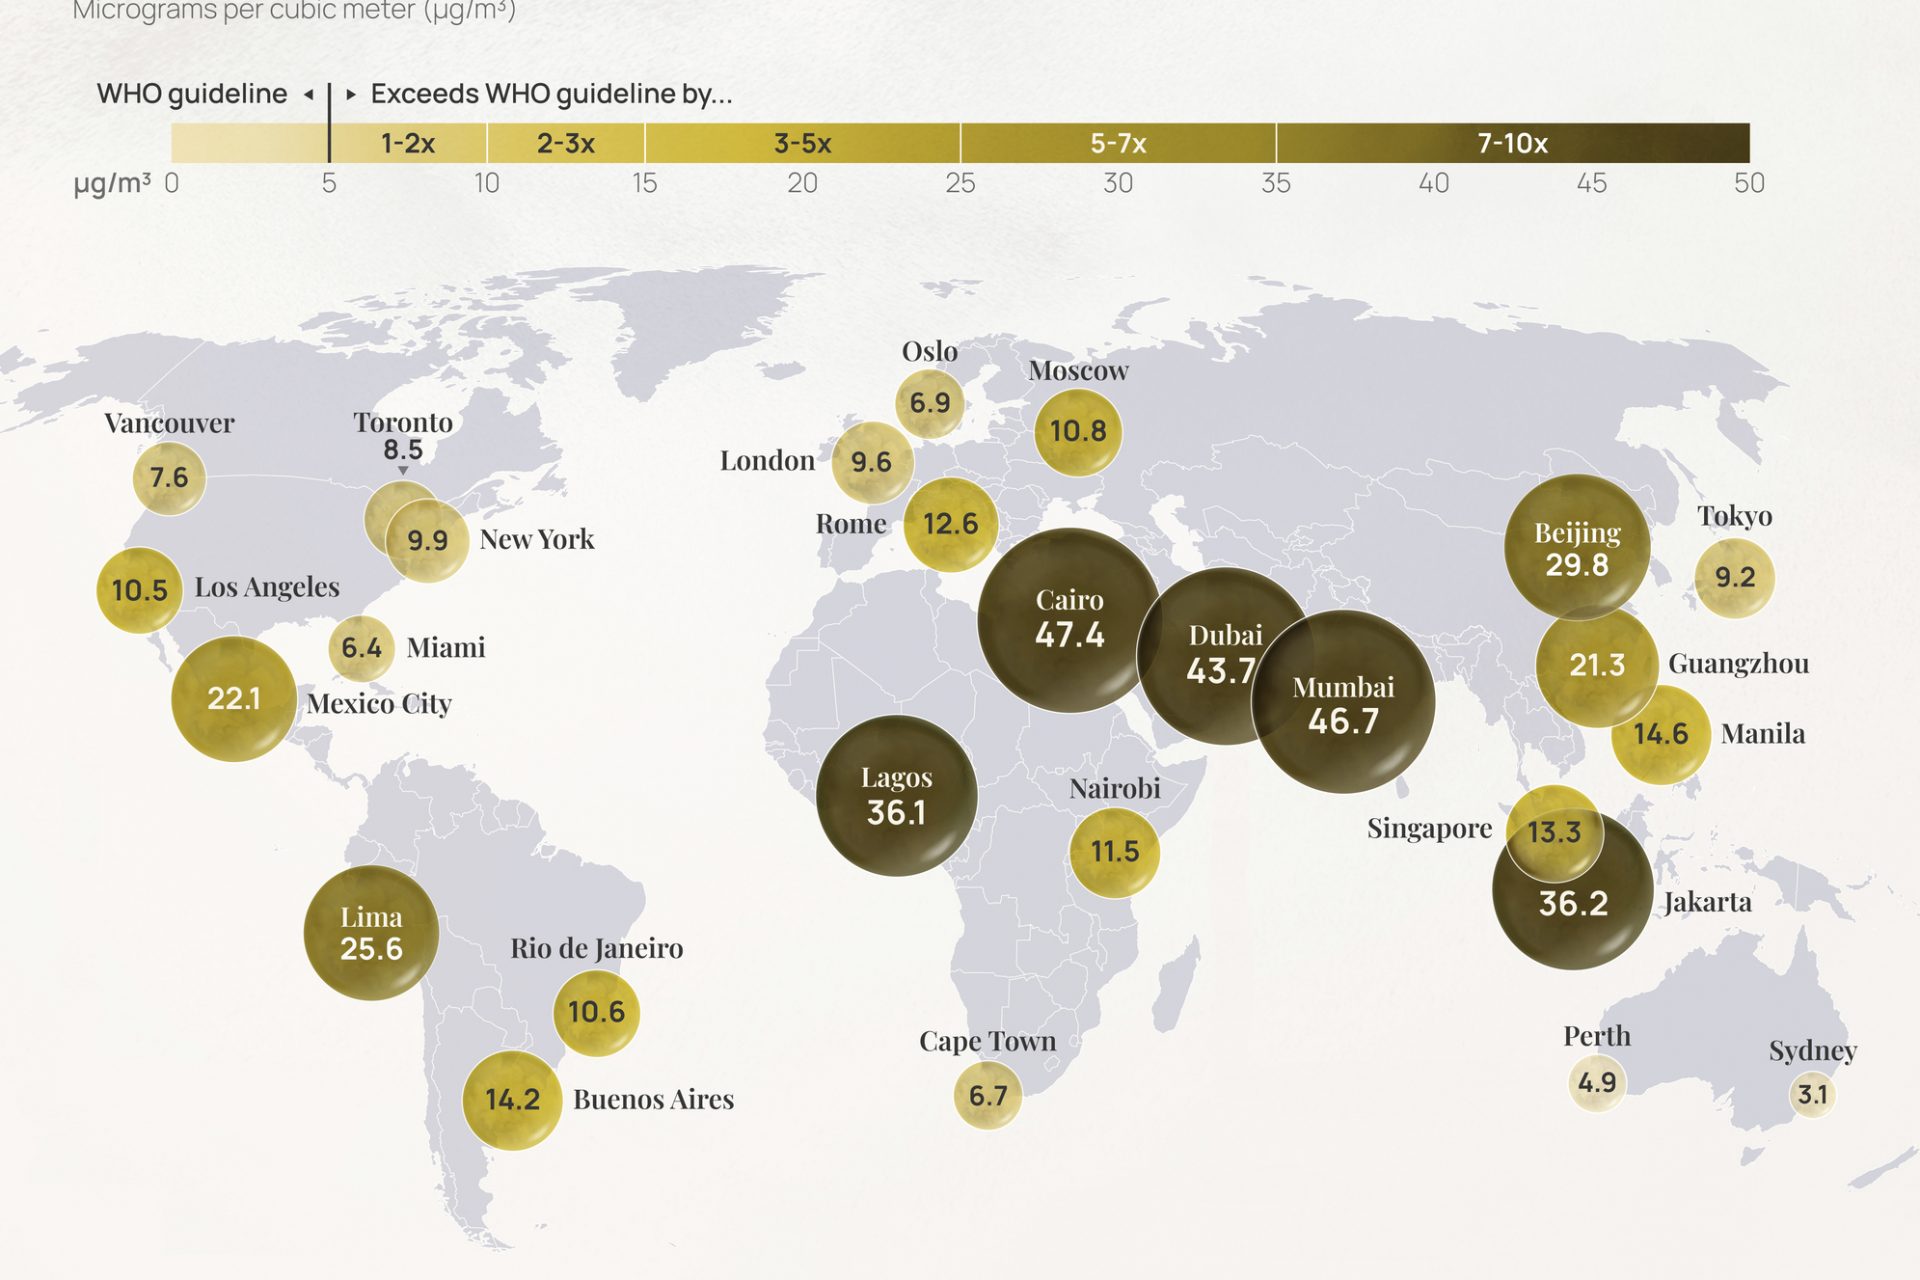
What annual levels are safe?
The World Health Organization’s air quality guidelines have dictated that the annual average concentrations of PM2.5 should not exceed five micrograms per cubic meter of air, or 5 µg/m³. With that in mind, let’s look at the cities that blew well past that target.
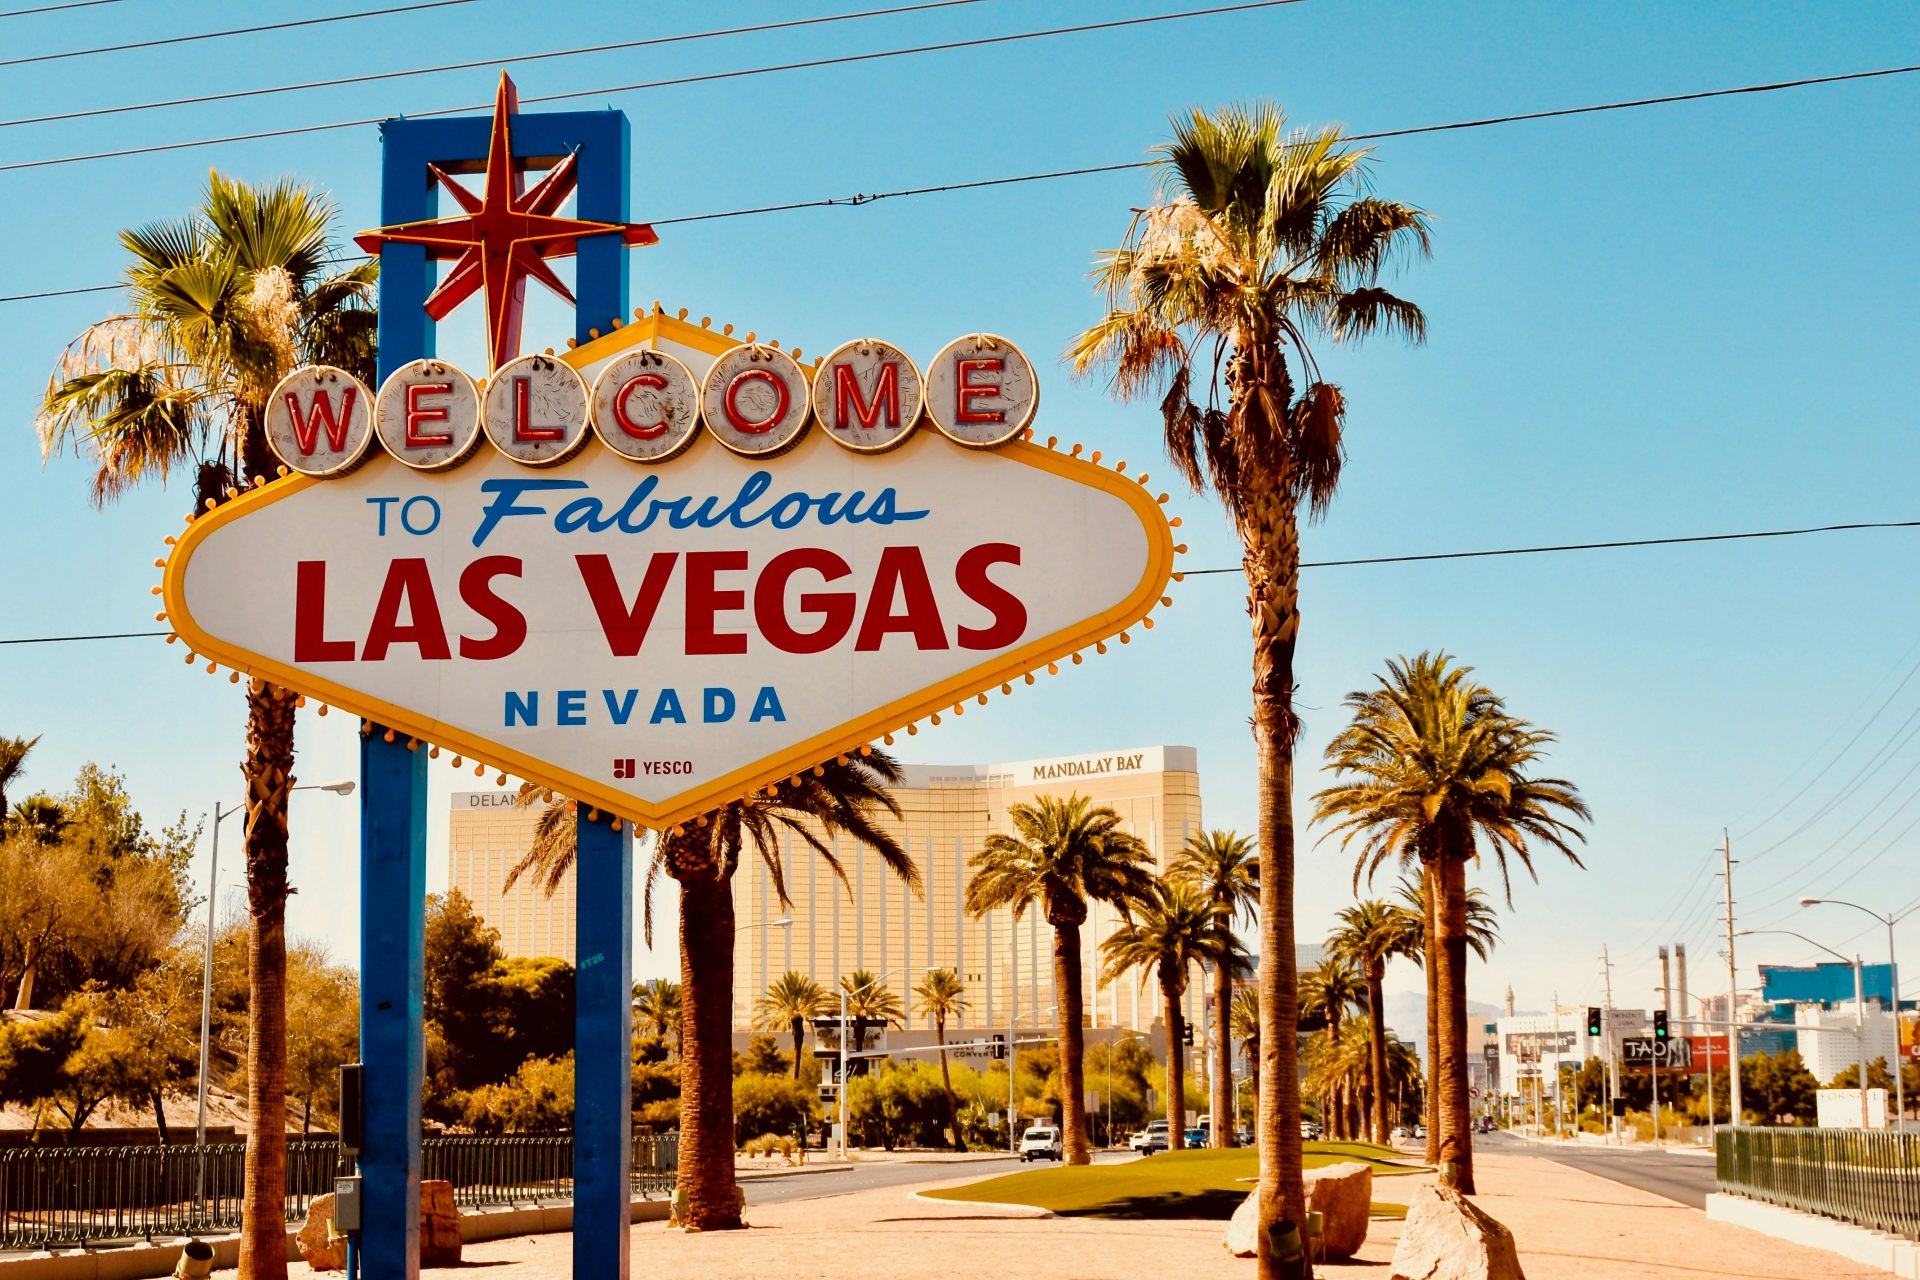
T19. Las Vegas, NV
Annual average concentration, 2020-2022: 10.8 µg/m³
Tied for 19th with Kansas City, KS
Photo by Grant Cai on Unsplash
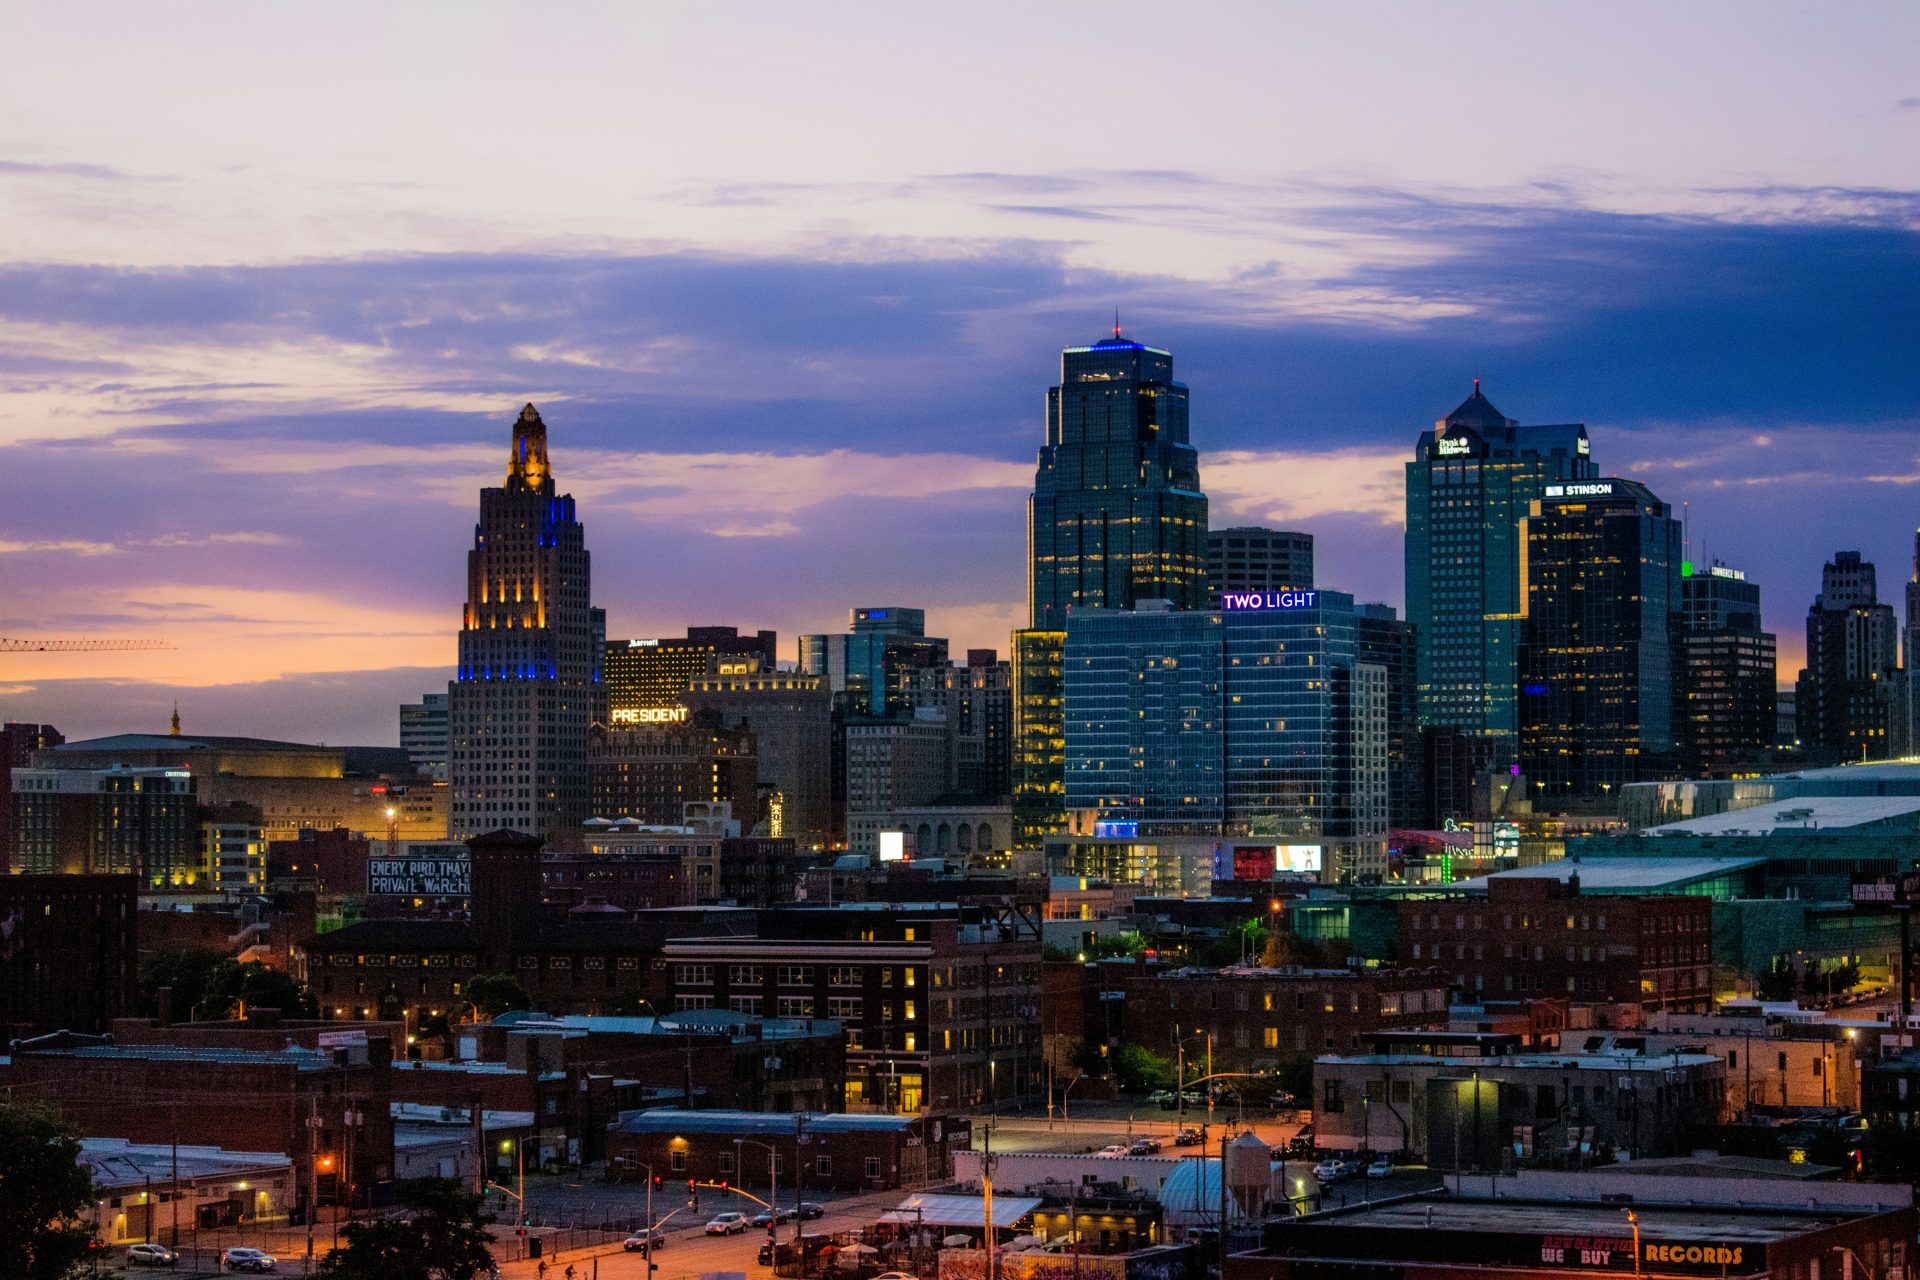
19. Kansas City, KS
Annual average concentration, 2020-2022: 10.8 µg/m³
Tied for 19th with LAs Vegas, NV
Photo by Colton Sturgeon on Unsplash
18. Pittsburgh, PA
Annual average concentration, 2020-2022: 10.9 µg/m³
Photo by Jordan Faux on Unsplash
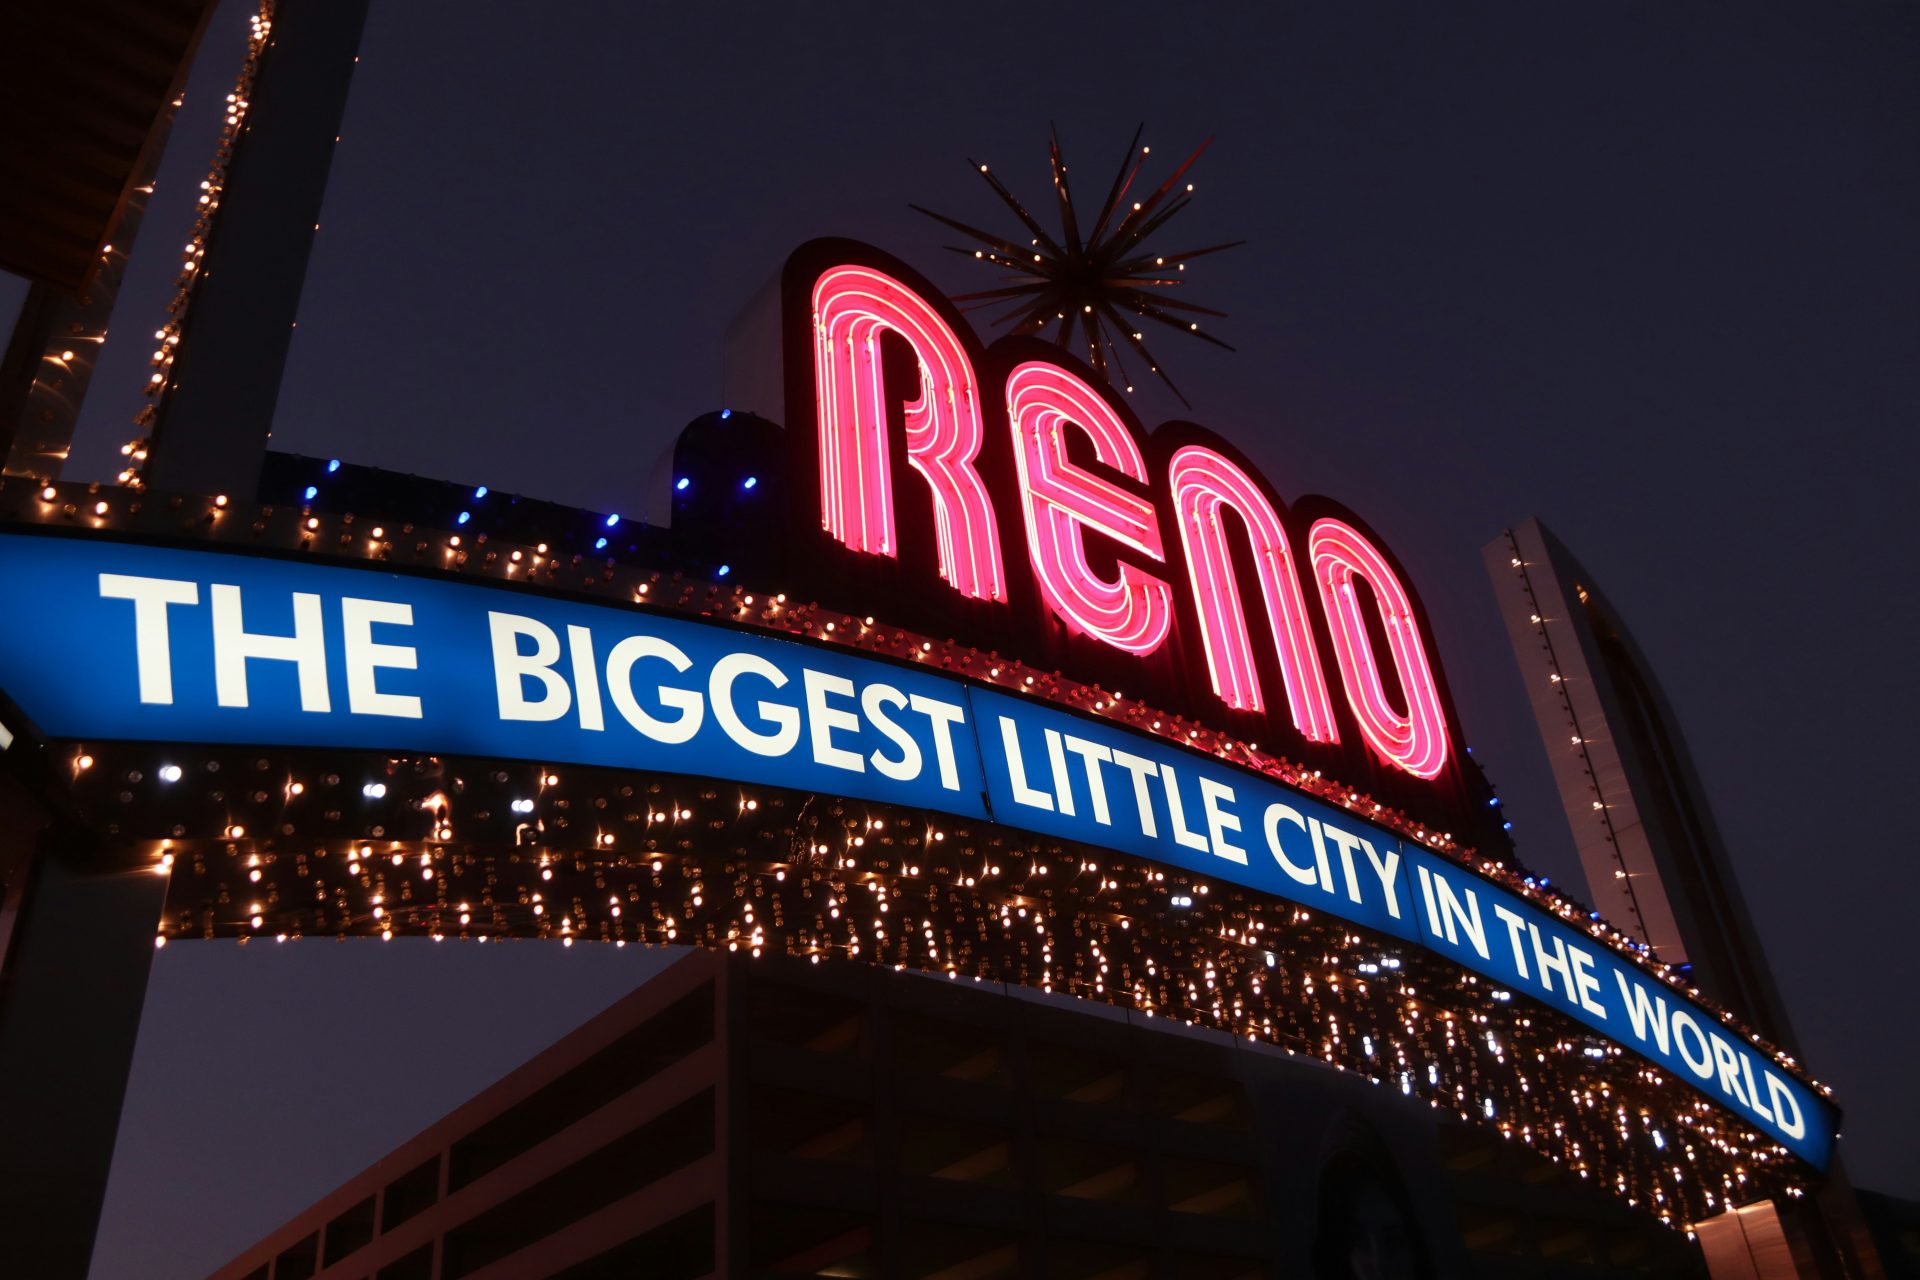
17. Reno, NV
Annual average concentration, 2020-2022: 11.0 µg/m³
Photo by Manny Becerra on Unsplash
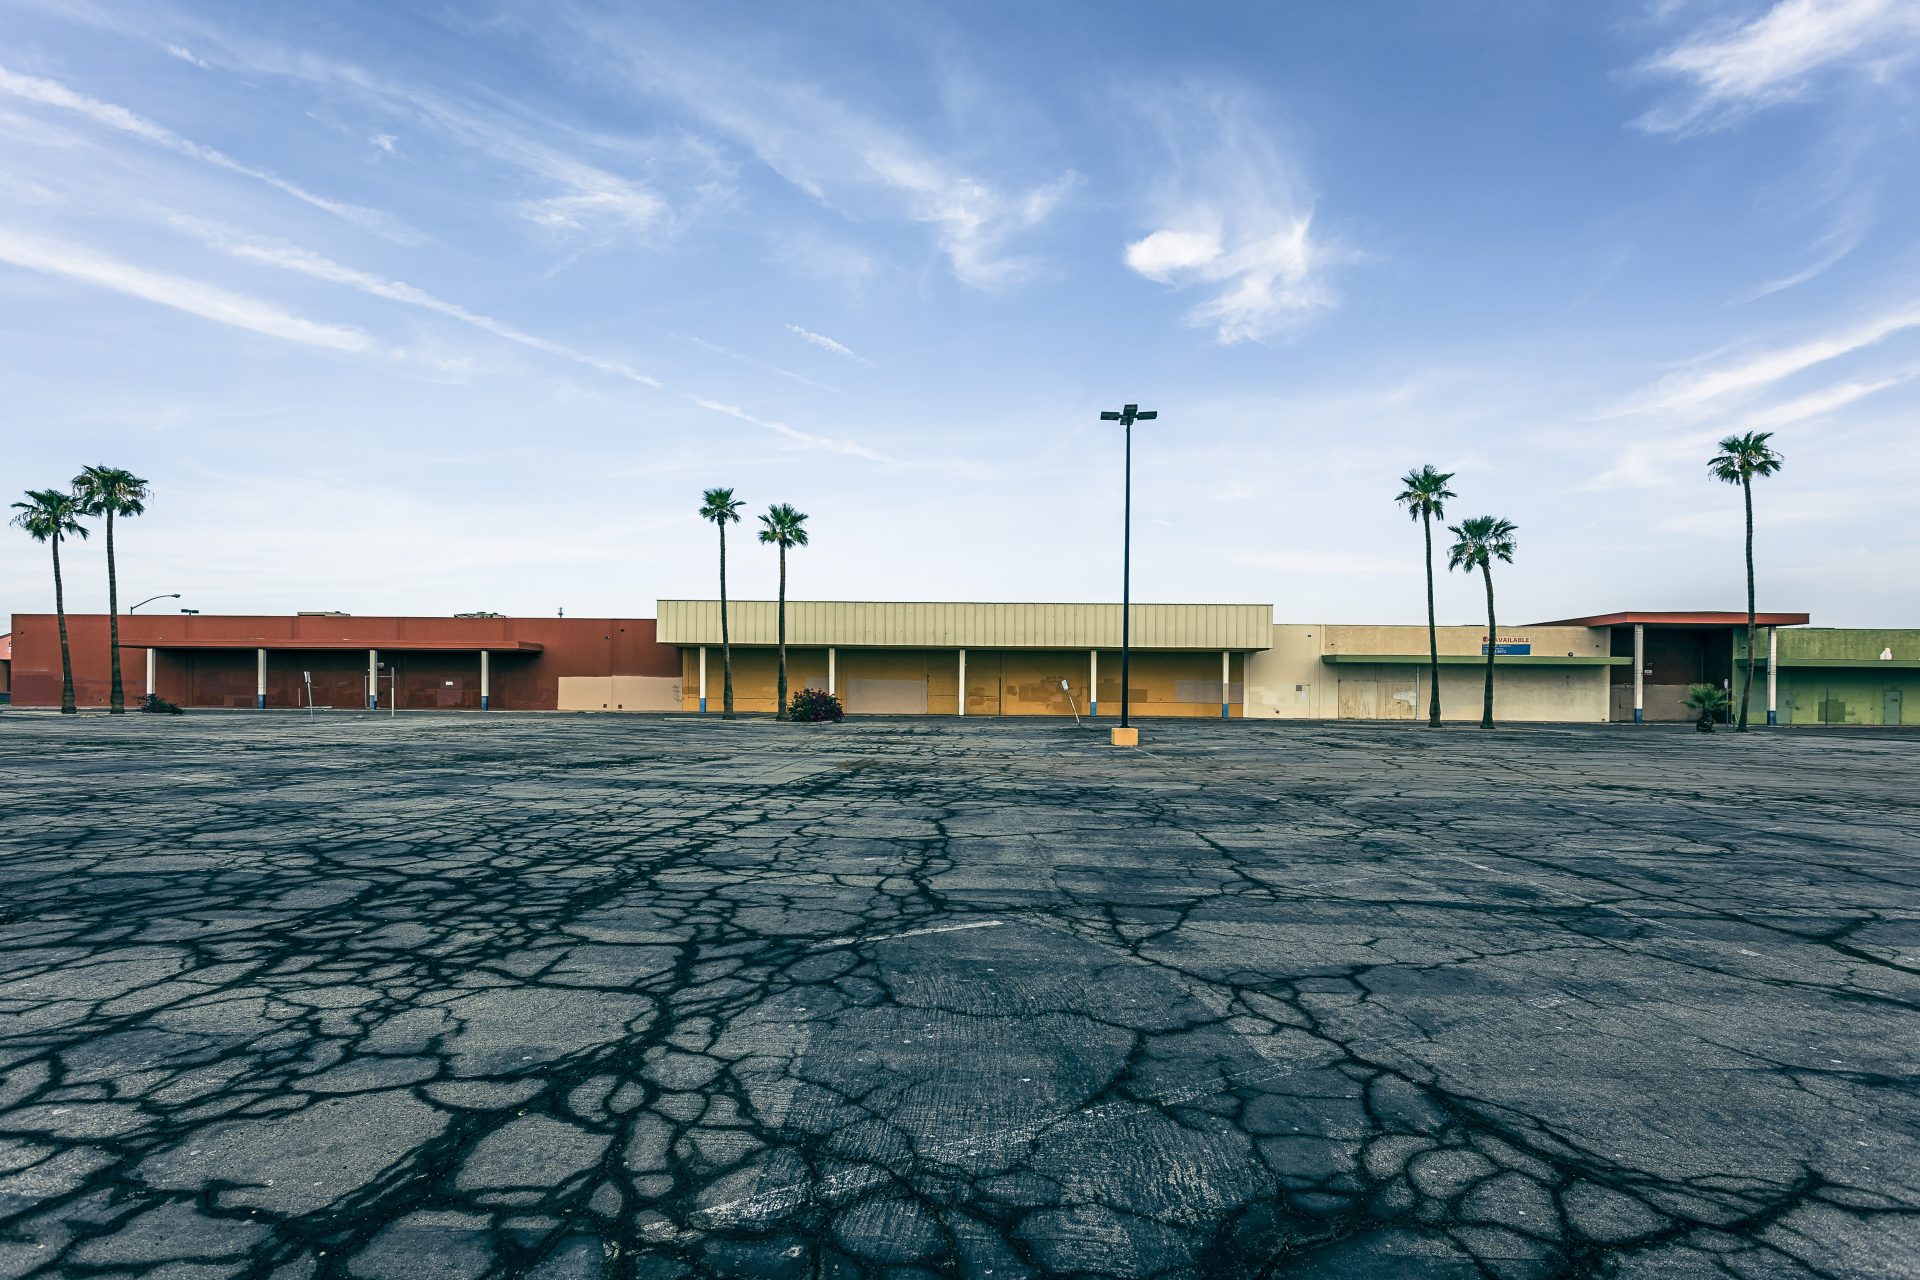
16. El Centro, CA
Annual average concentration, 2020-2022: 11.1 µg/m³
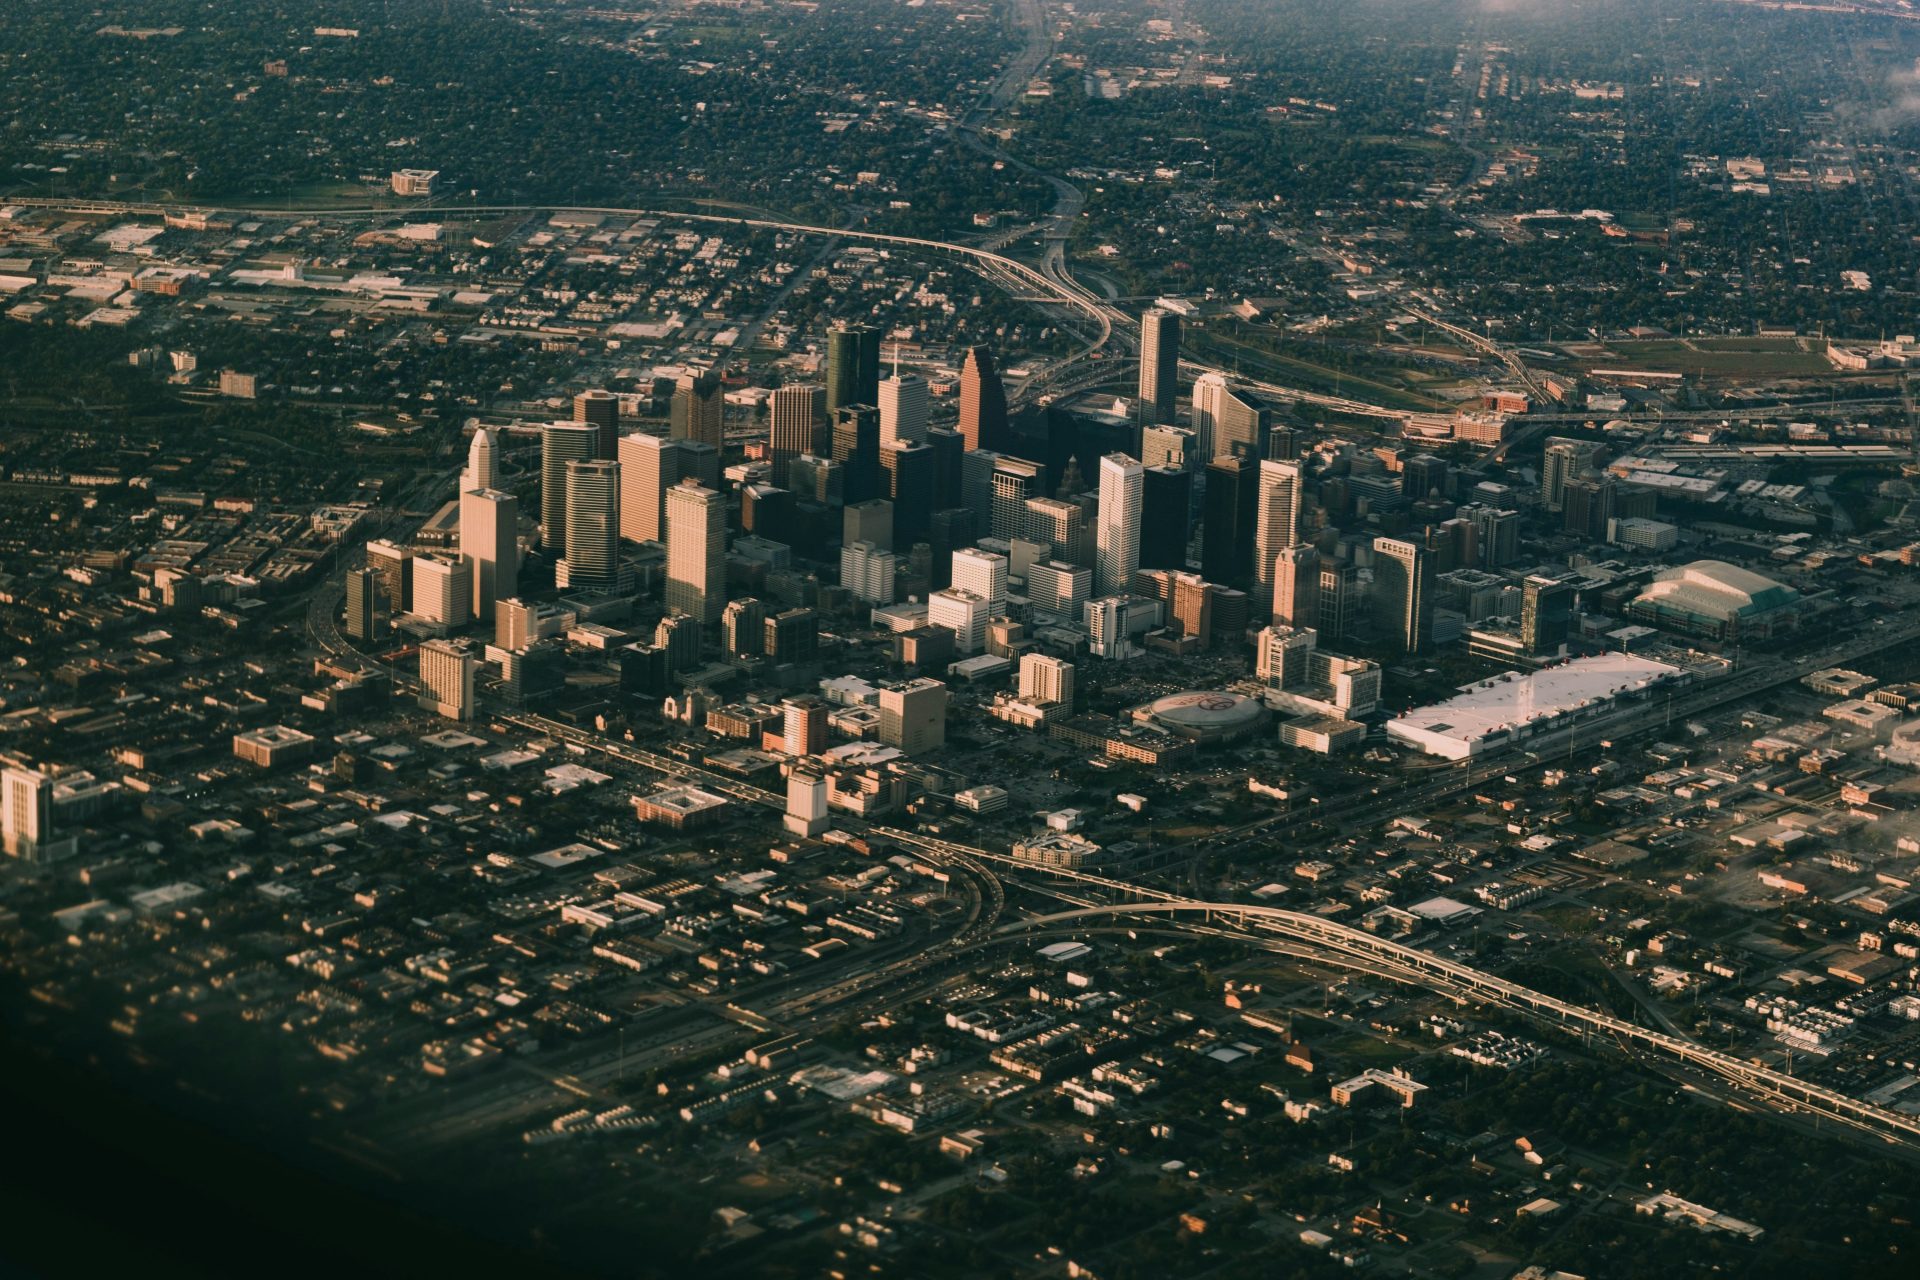
15. Houston, TX
Annual average concentration, 2020-2022: 11.4 µg/m³
Photo by Mickey Dziwulski on Unsplash
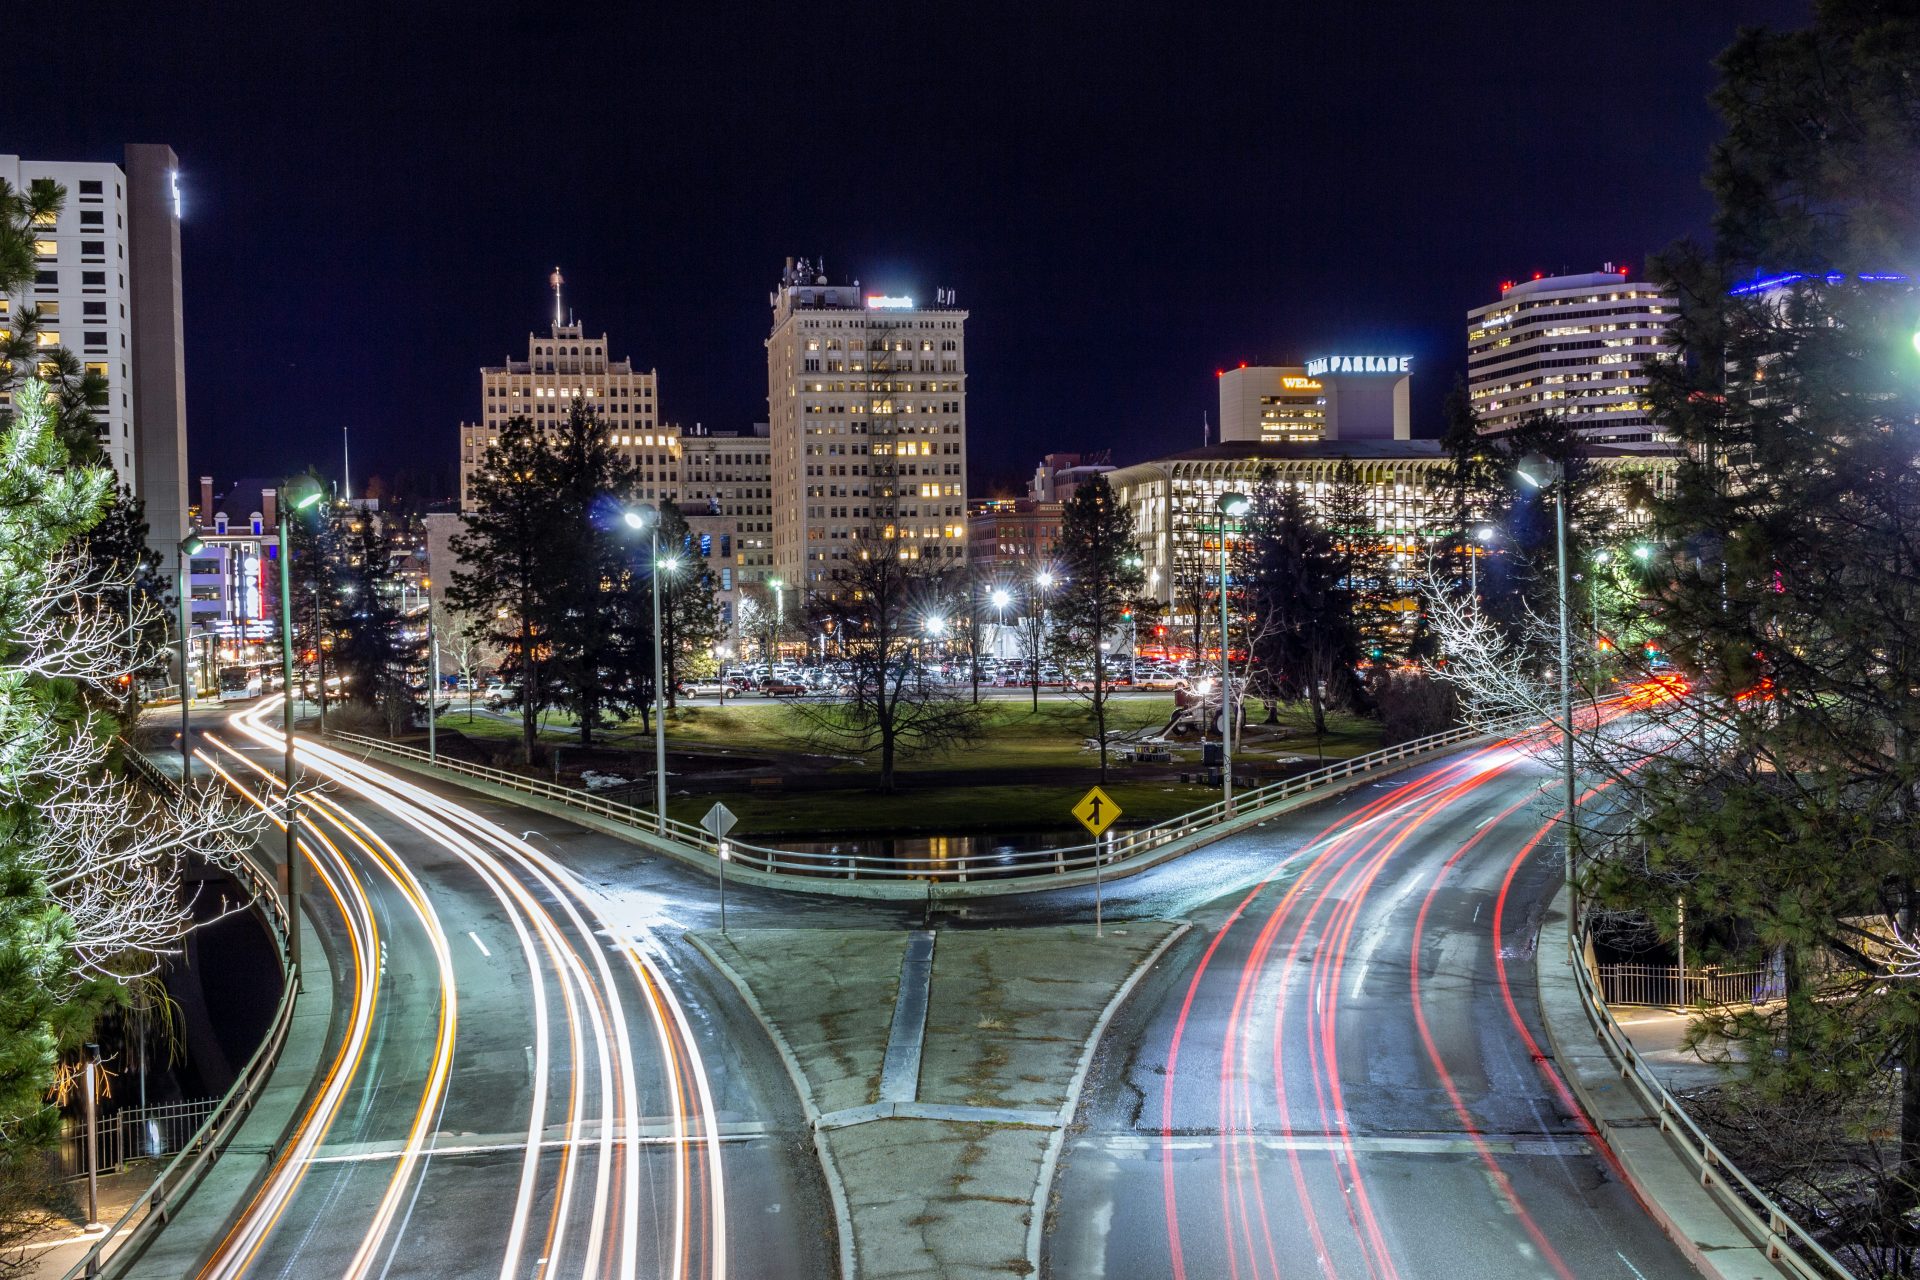
T14. Spokane, WA
Annual average concentration, 2020-2022: 11.6 µg/m³
Tied for 14th with Chico, CA
Photo by Clay Elliot on Unsplash
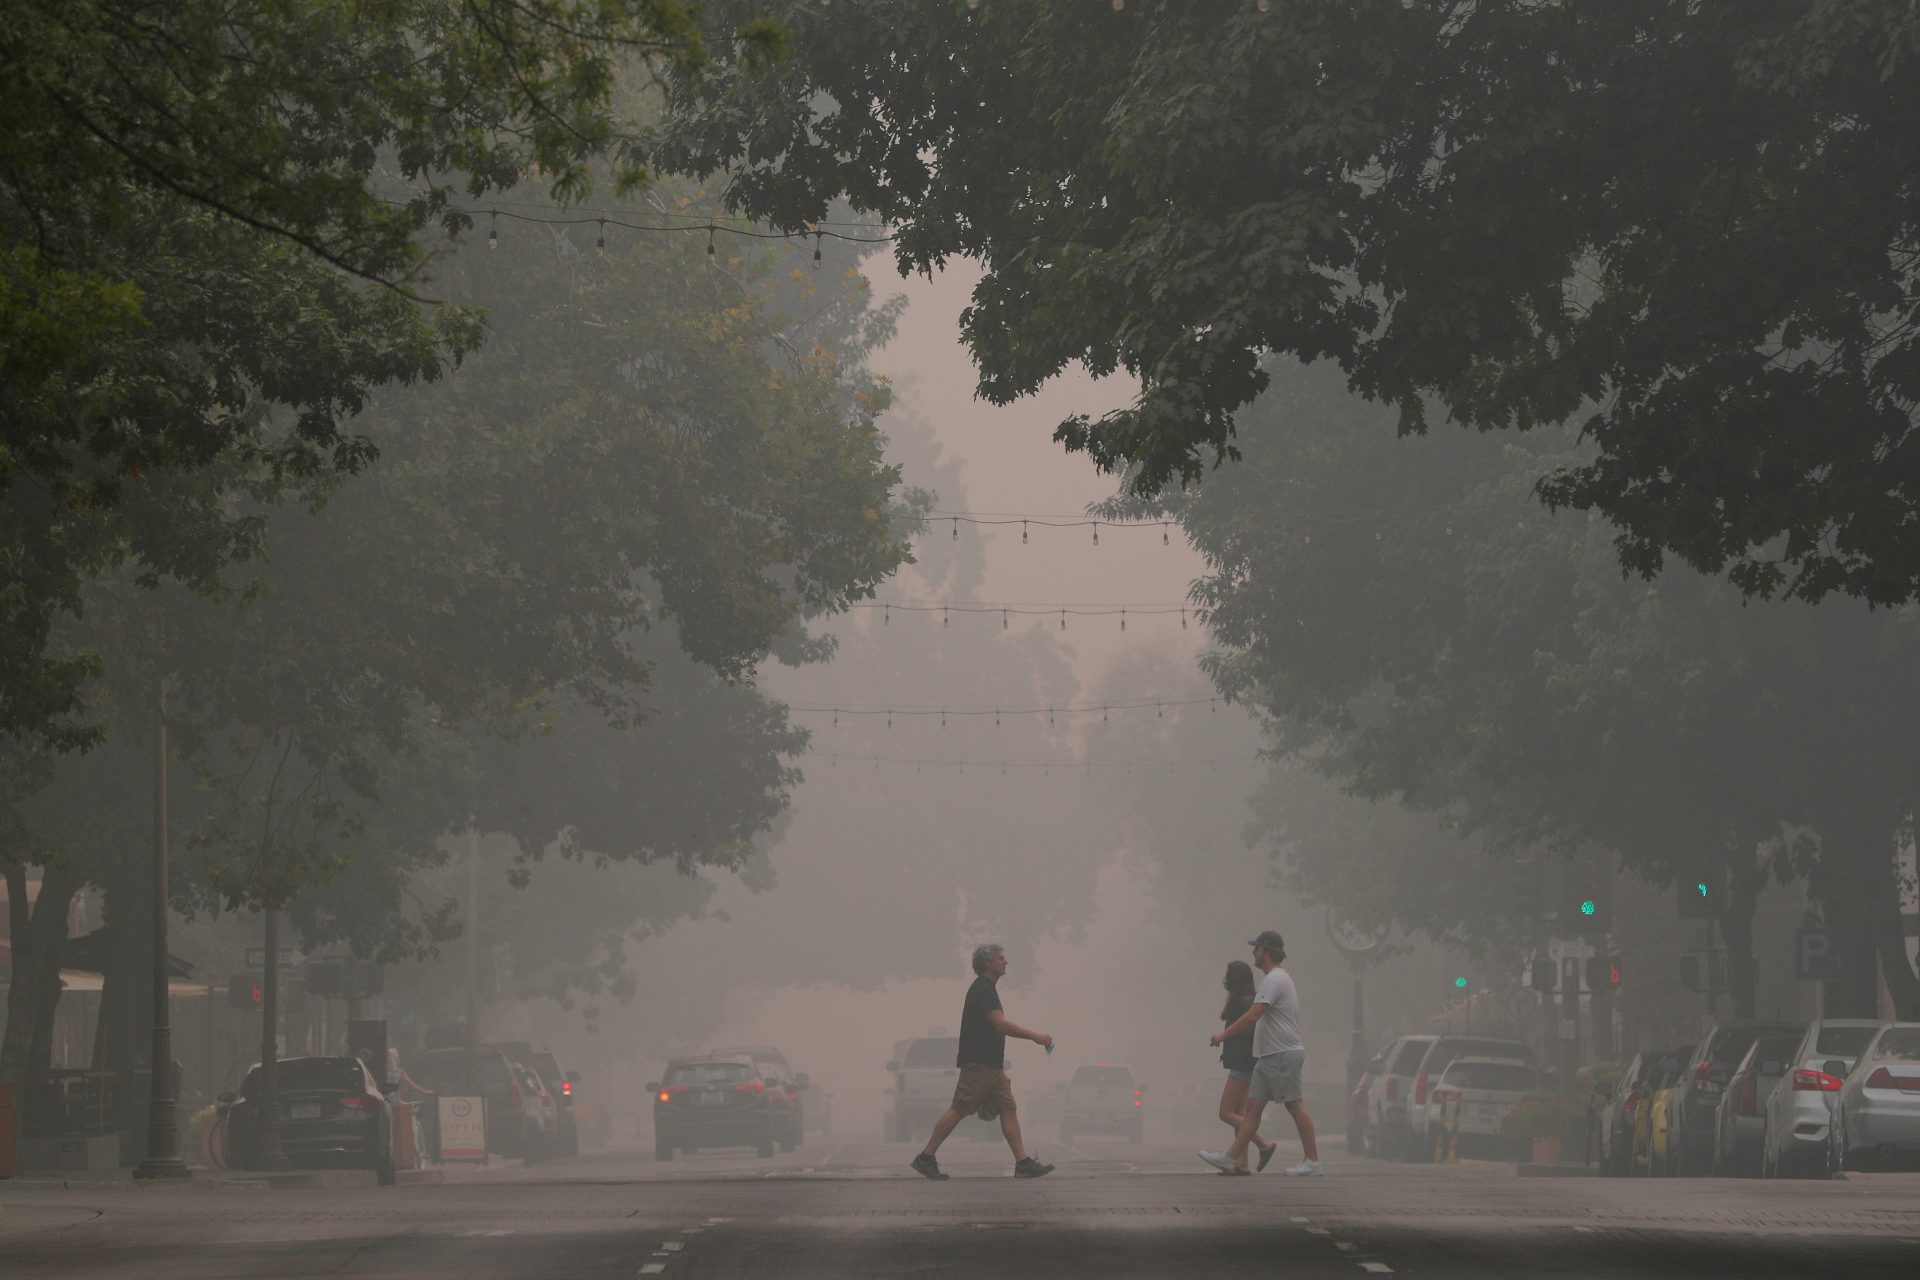
T14. Chico, CA
Annual average concentration, 2020-2022: 11.6 µg/m³
Tied for 14th with Spokane, WA
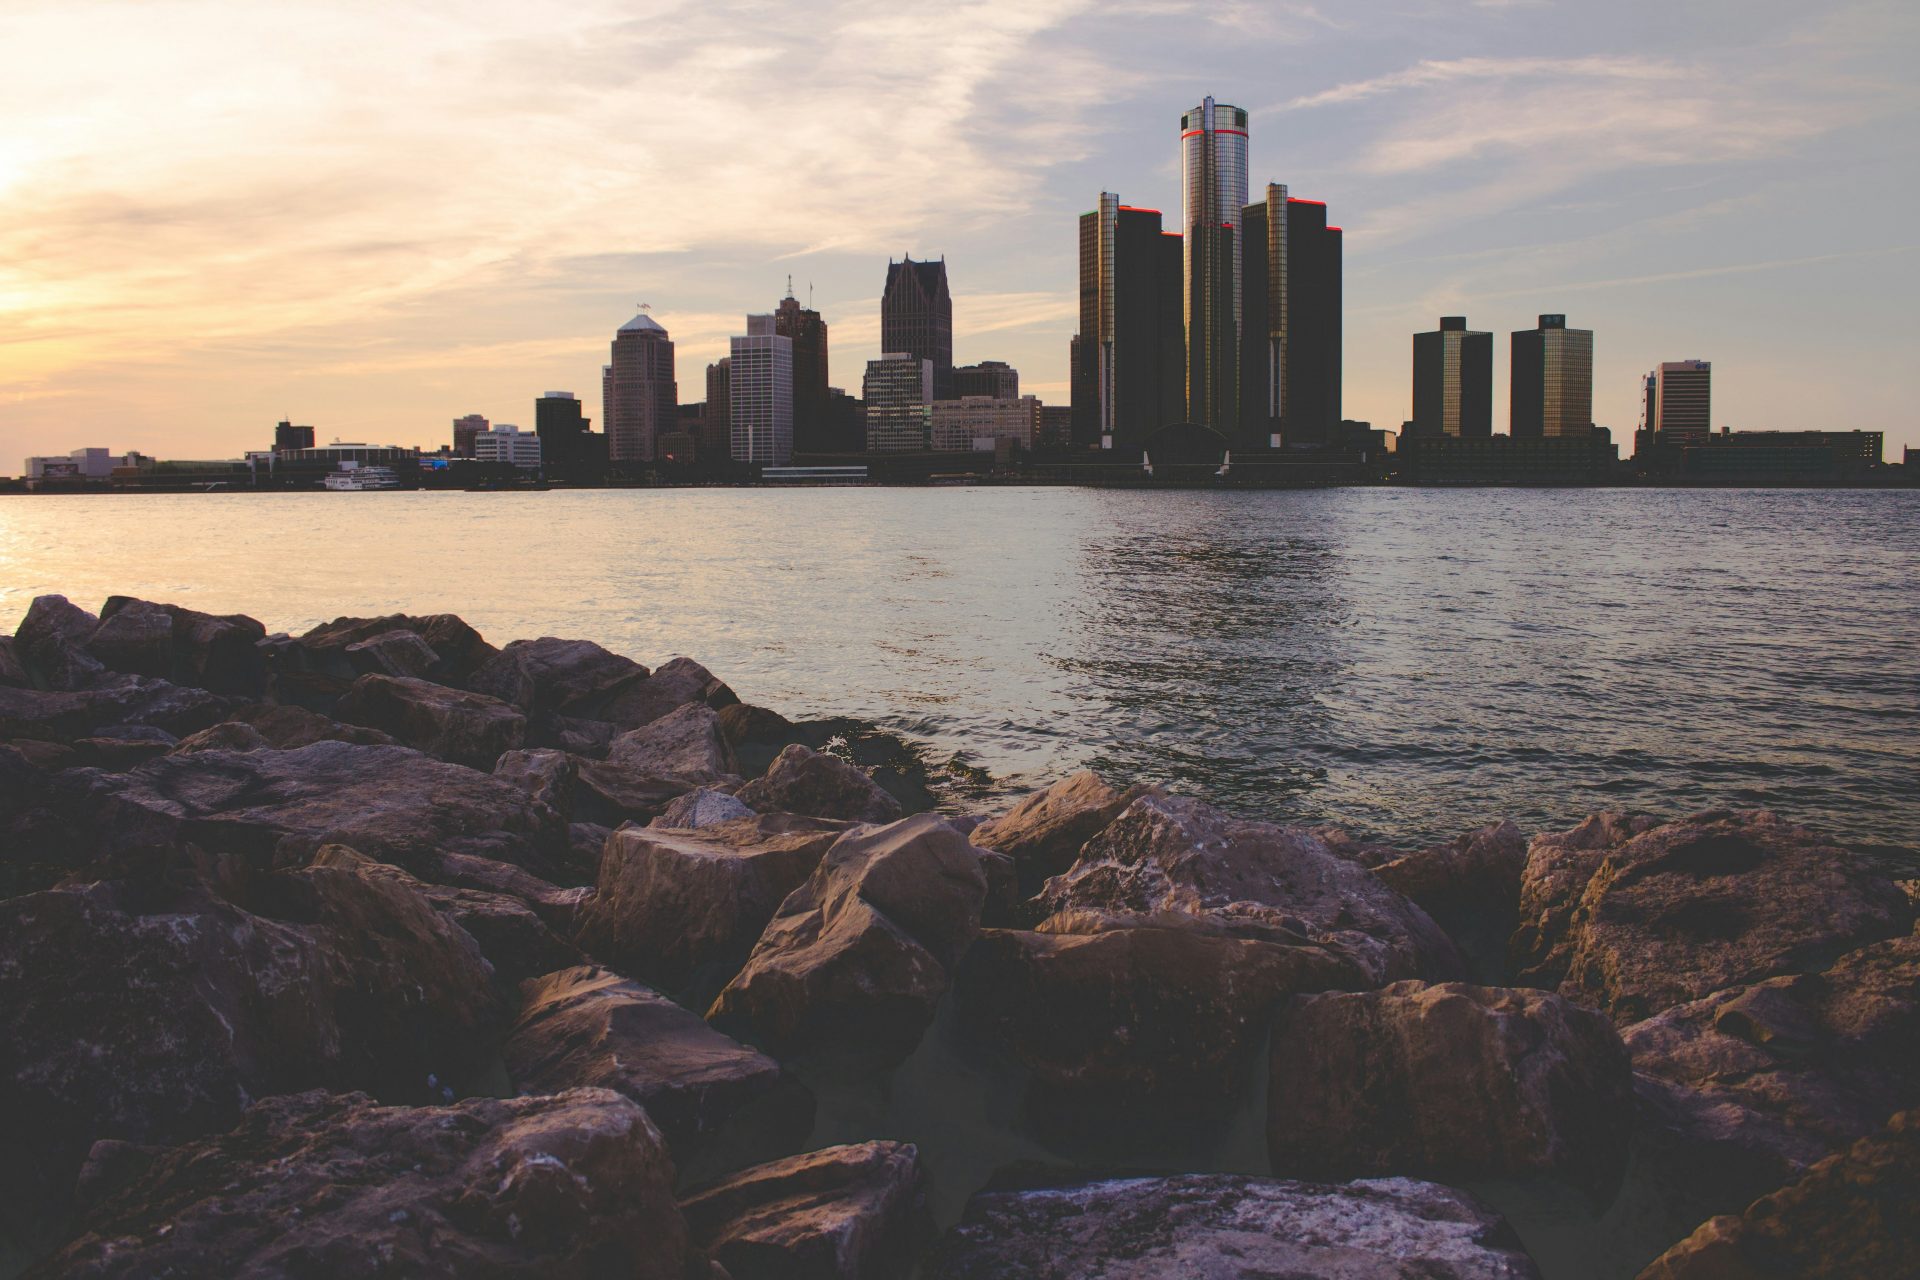
13. Detroit, MI
Annual average concentration, 2020-2022: 11.7 µg/m³
Photo by Nadine Shaabana on Unsplash
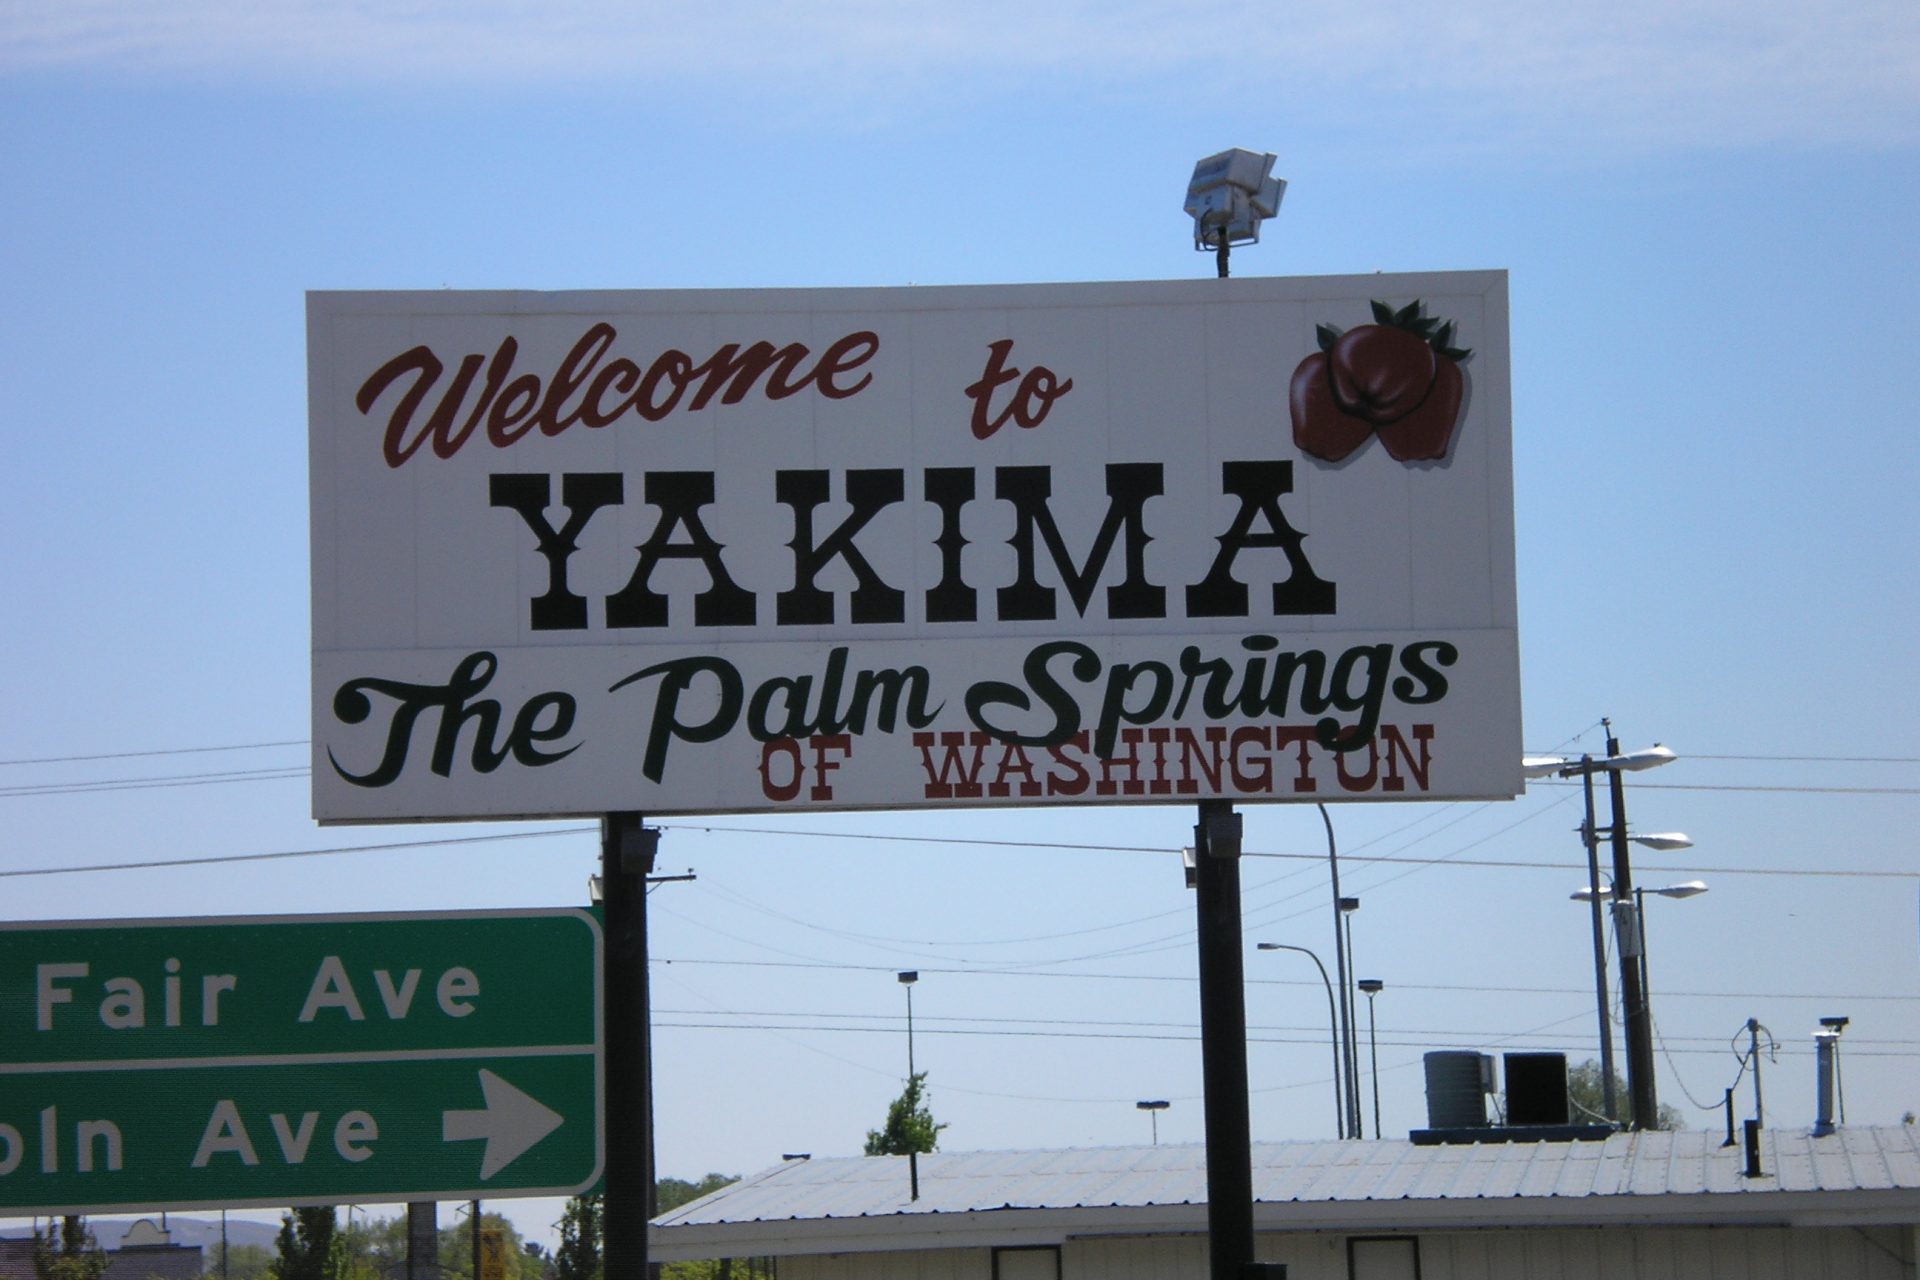
12. Yakima, WA
Annual average concentration, 2020-2022: 11.8 µg/m³
Photo: Wiki Commons By AirLiner, CC BY-SA 3.0
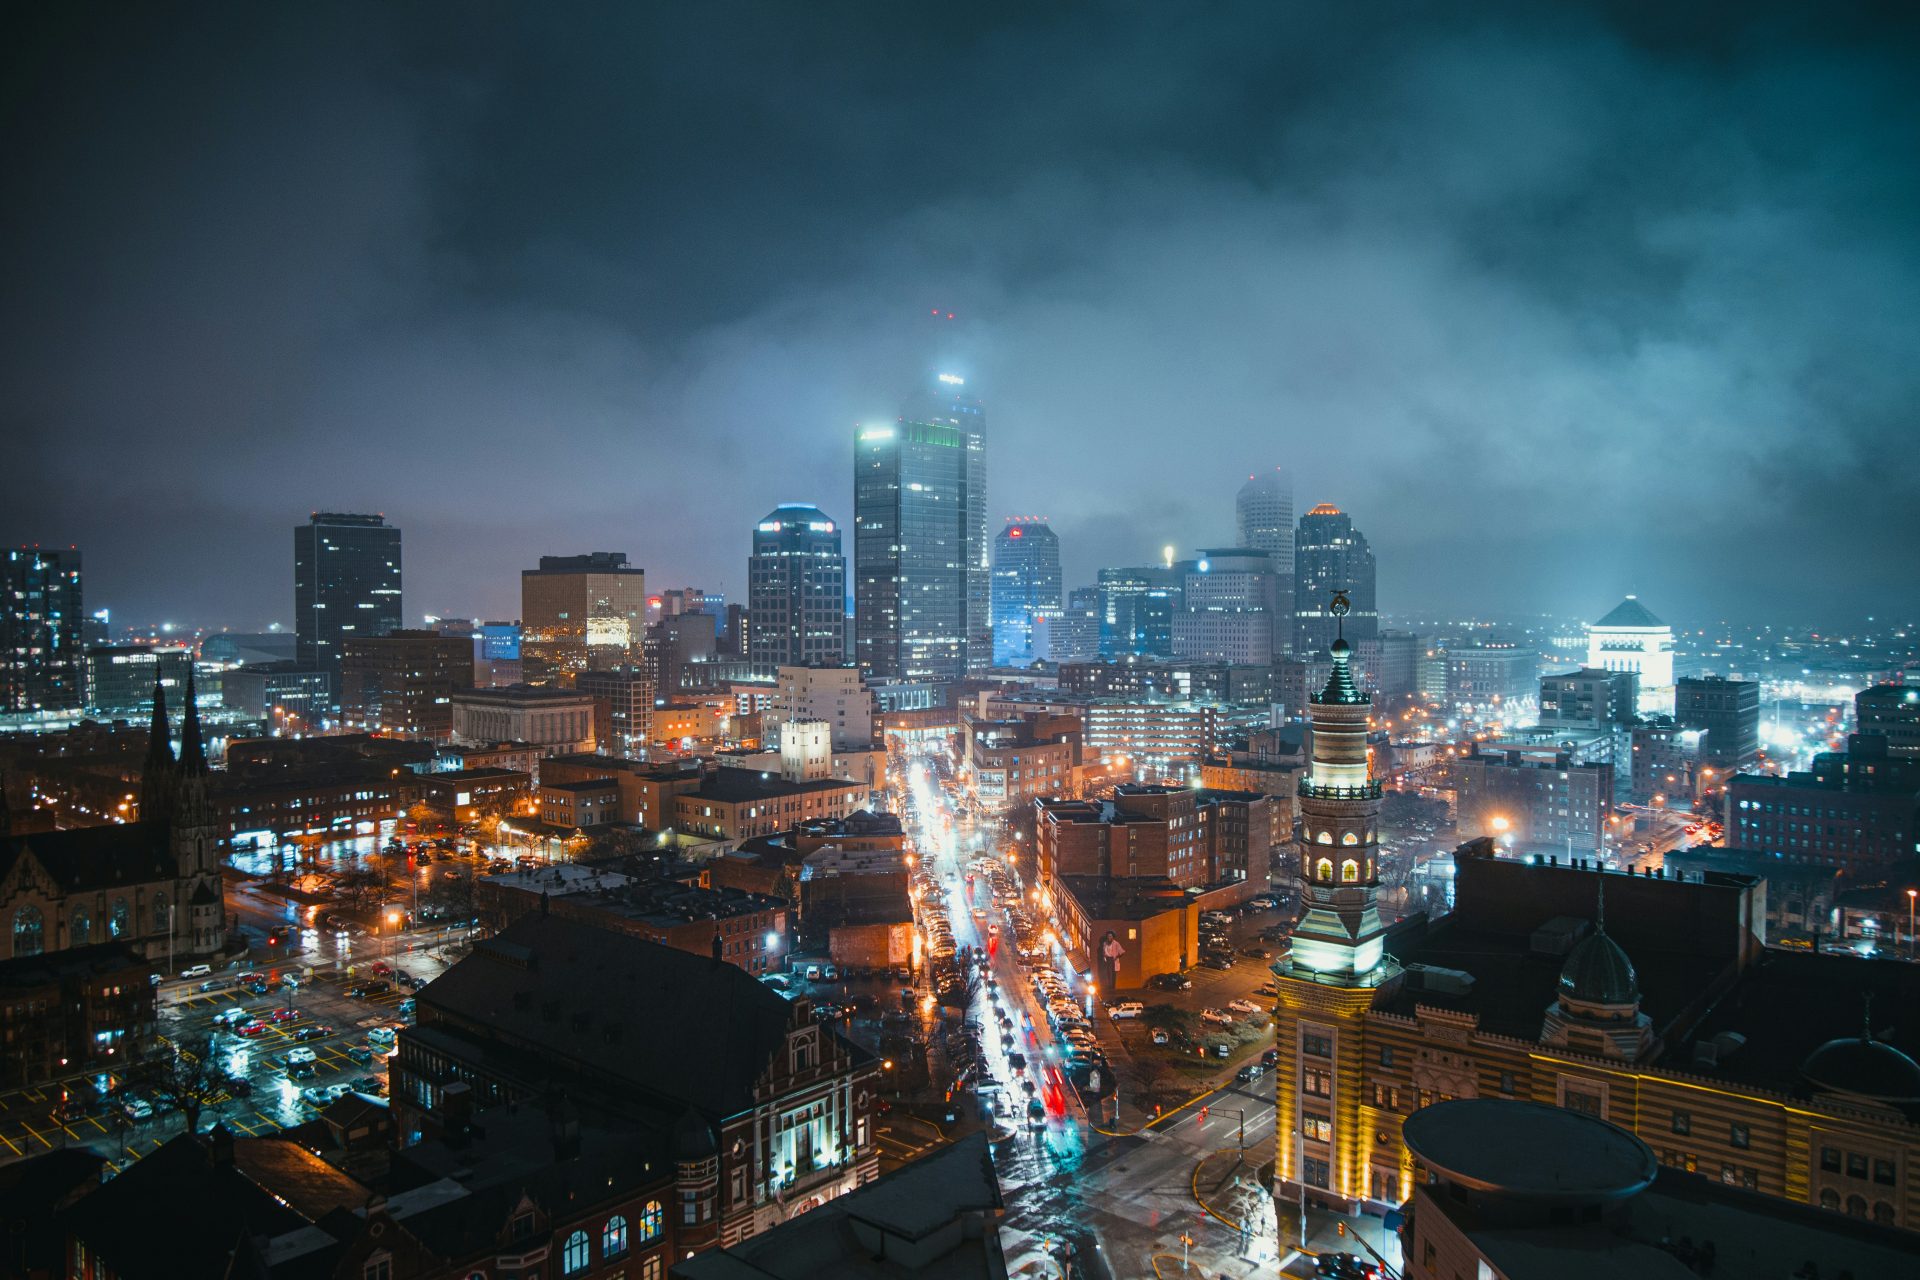
11. Indianapolis, IN
Annual average concentration, 2020-2022: 11.9 µg/m³
Photo by Josh Hild on Unsplash
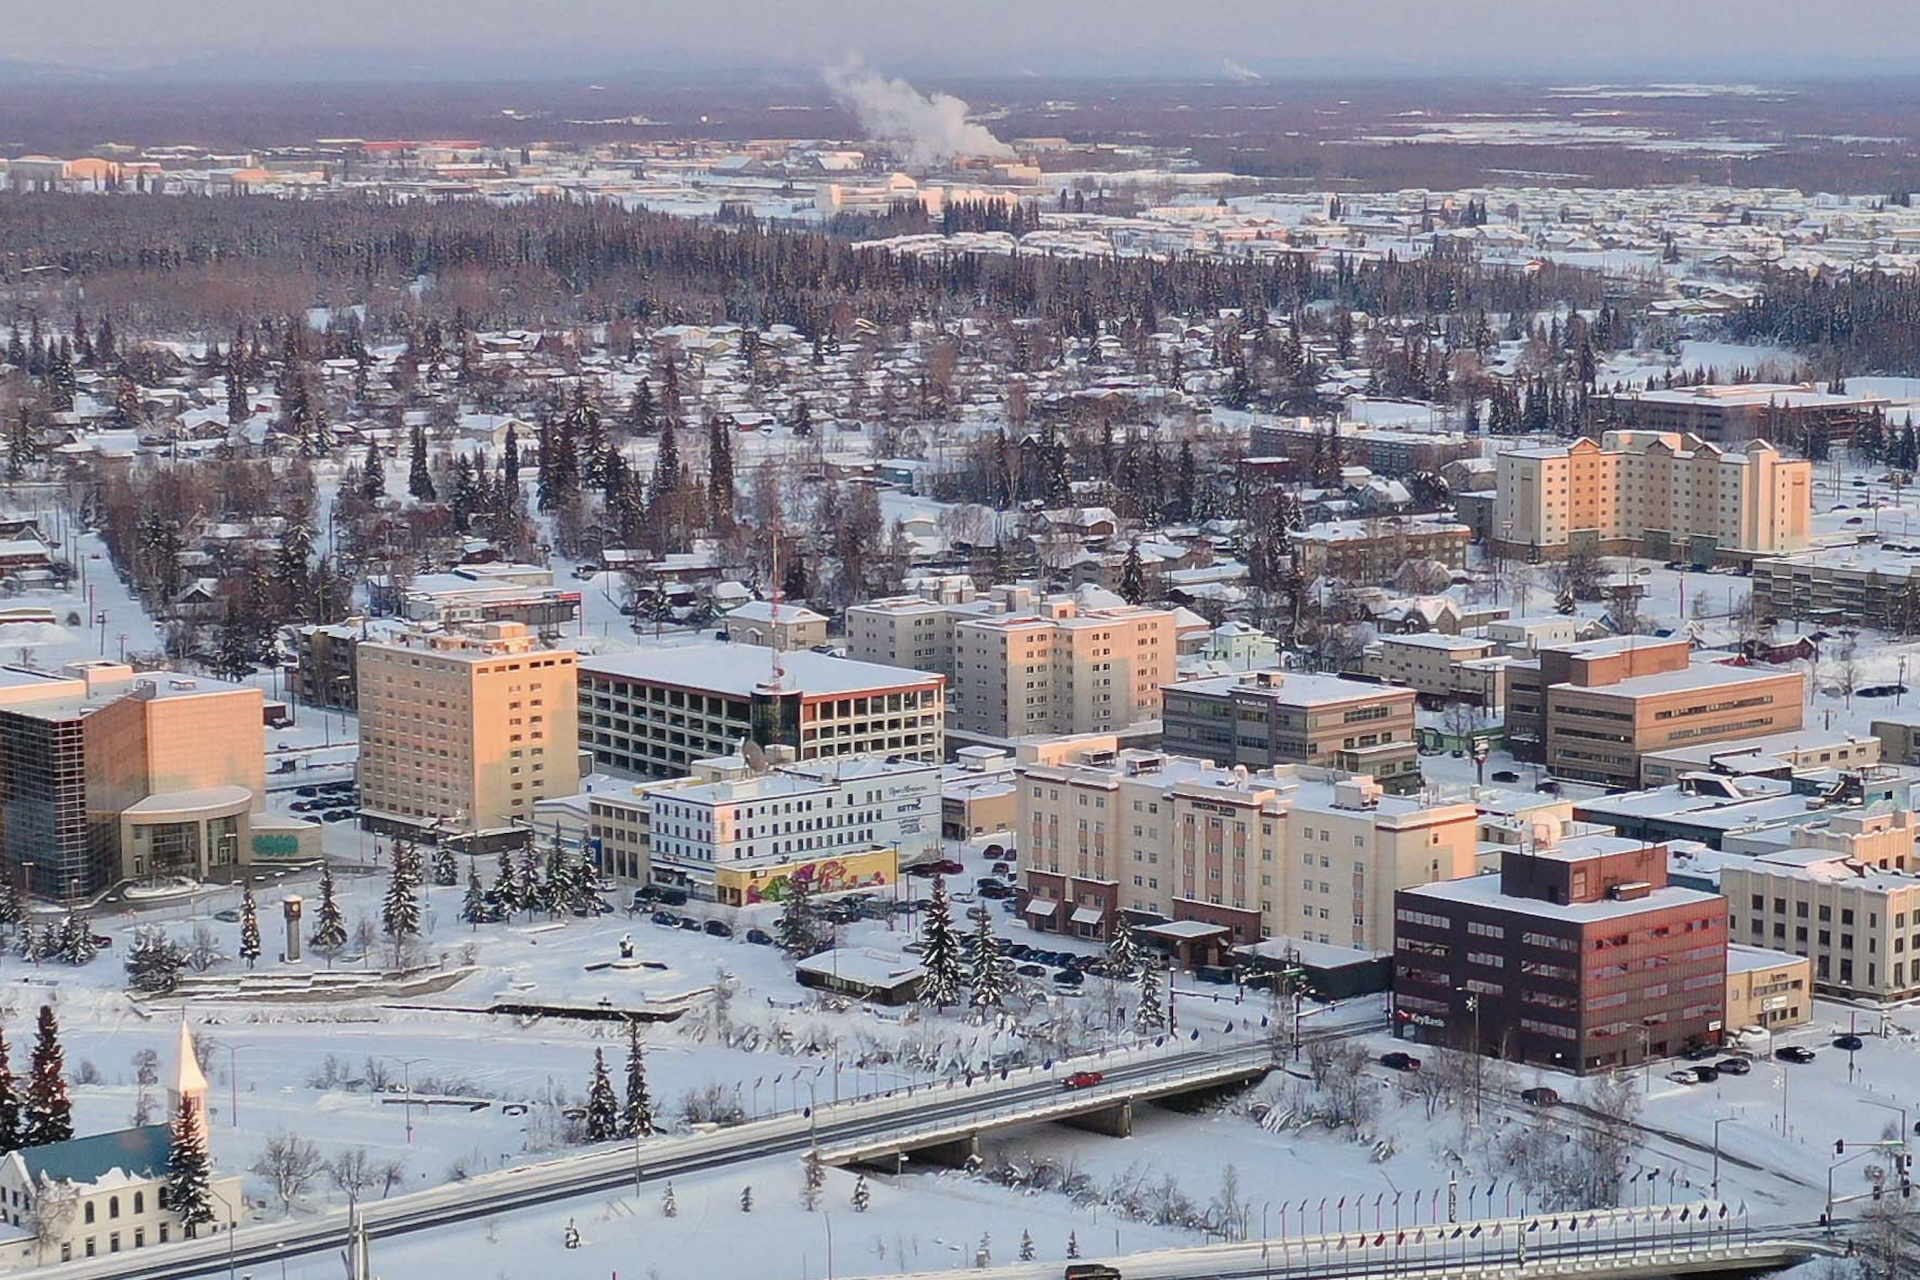
10. Fairbanks, AK
Annual average concentration, 2020-2022: 12.2 µg/m³
Photo: Wiki Commons By Quintin Soloviev, CC BY-SA 4.0
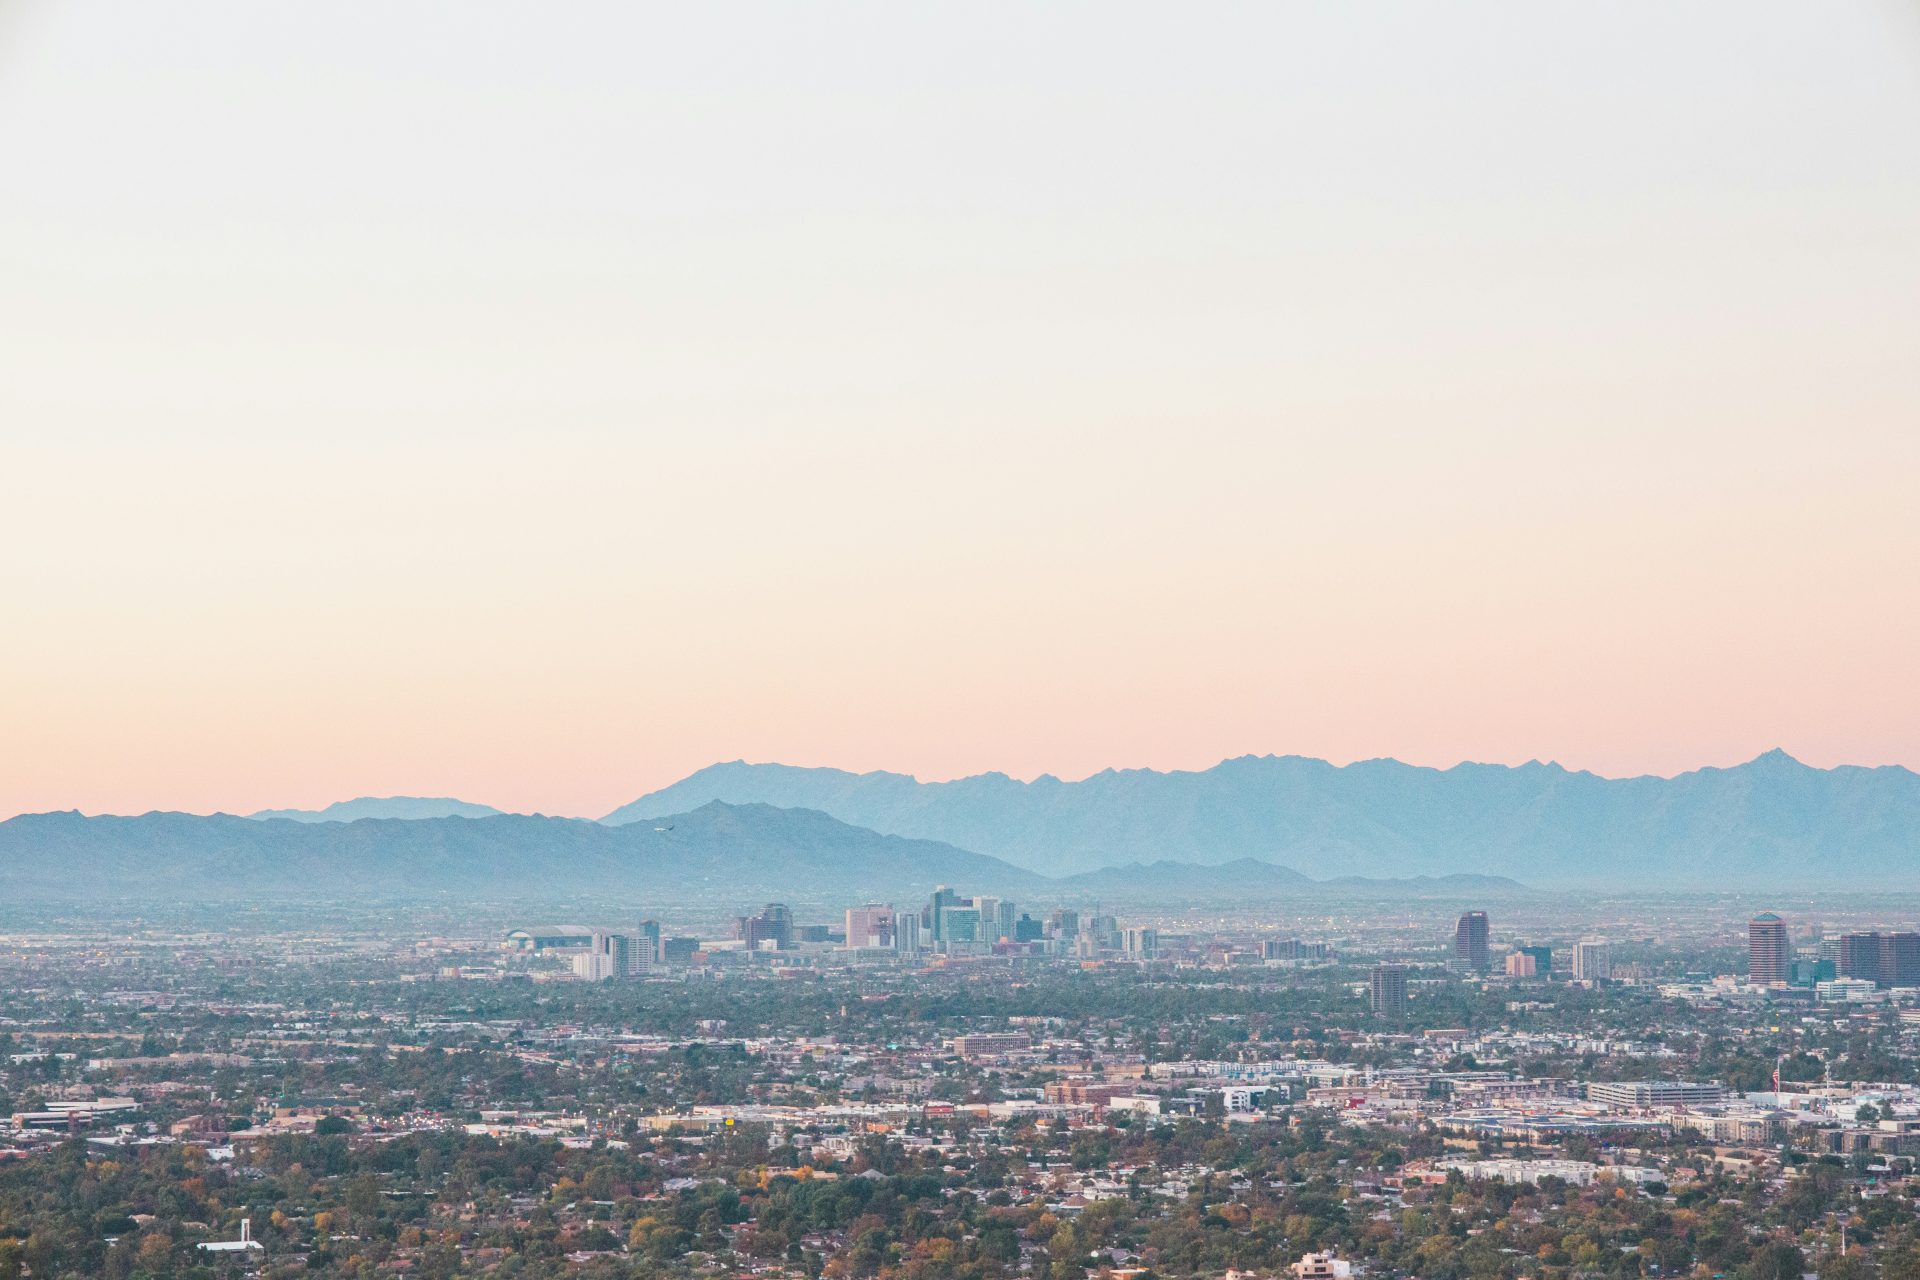
9. Phoenix, AZ
Annual average concentration, 2020-2022: 12.4 µg/m³
Photo by Ian Dziuk on Unsplash
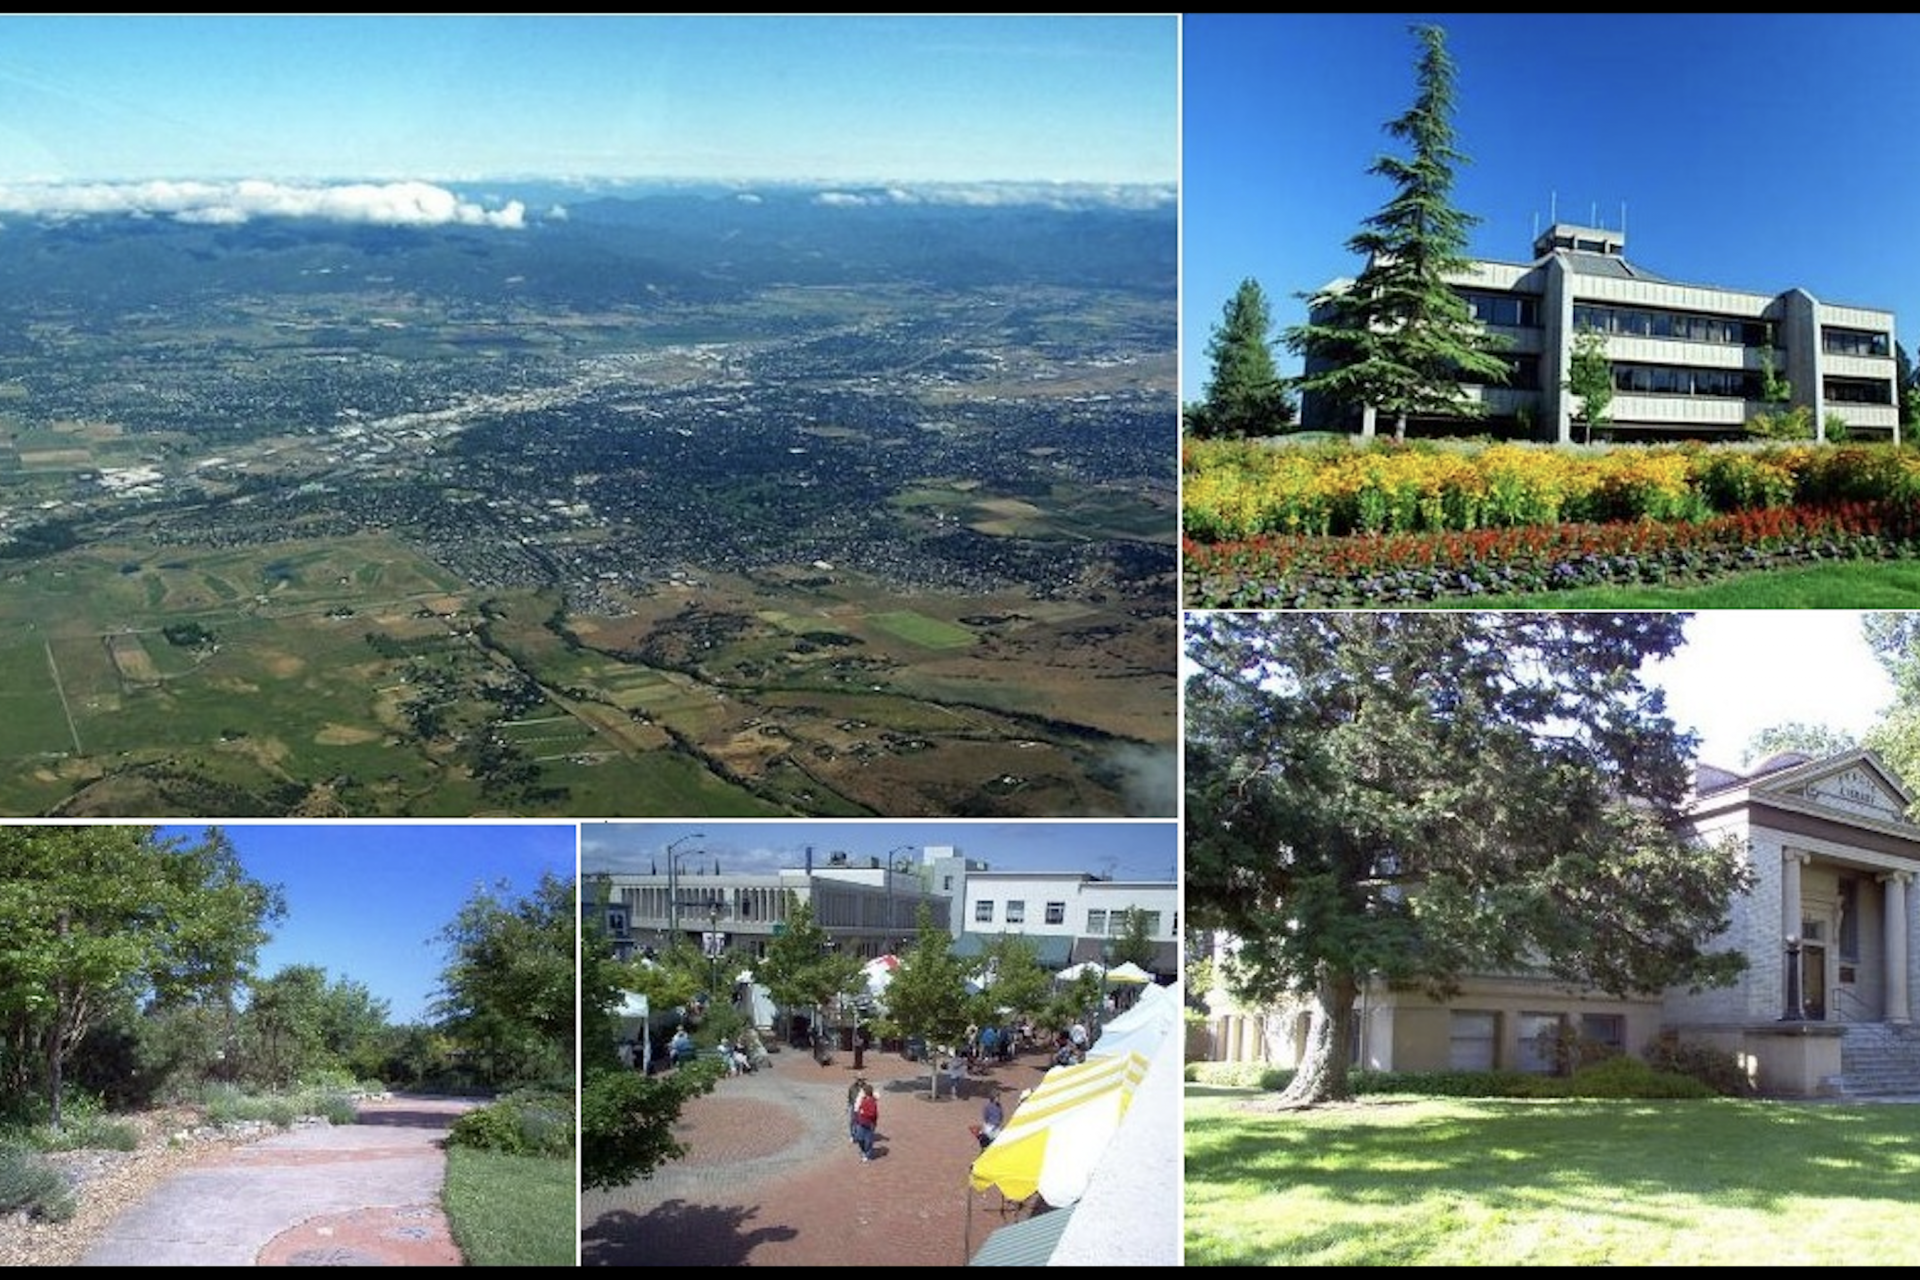
8. Medford, OR
Annual average concentration, 2020-2022: 12.2 µg/m³
Photo: Wiki Commons By CookieMonster755, CC BY-SA 3.0
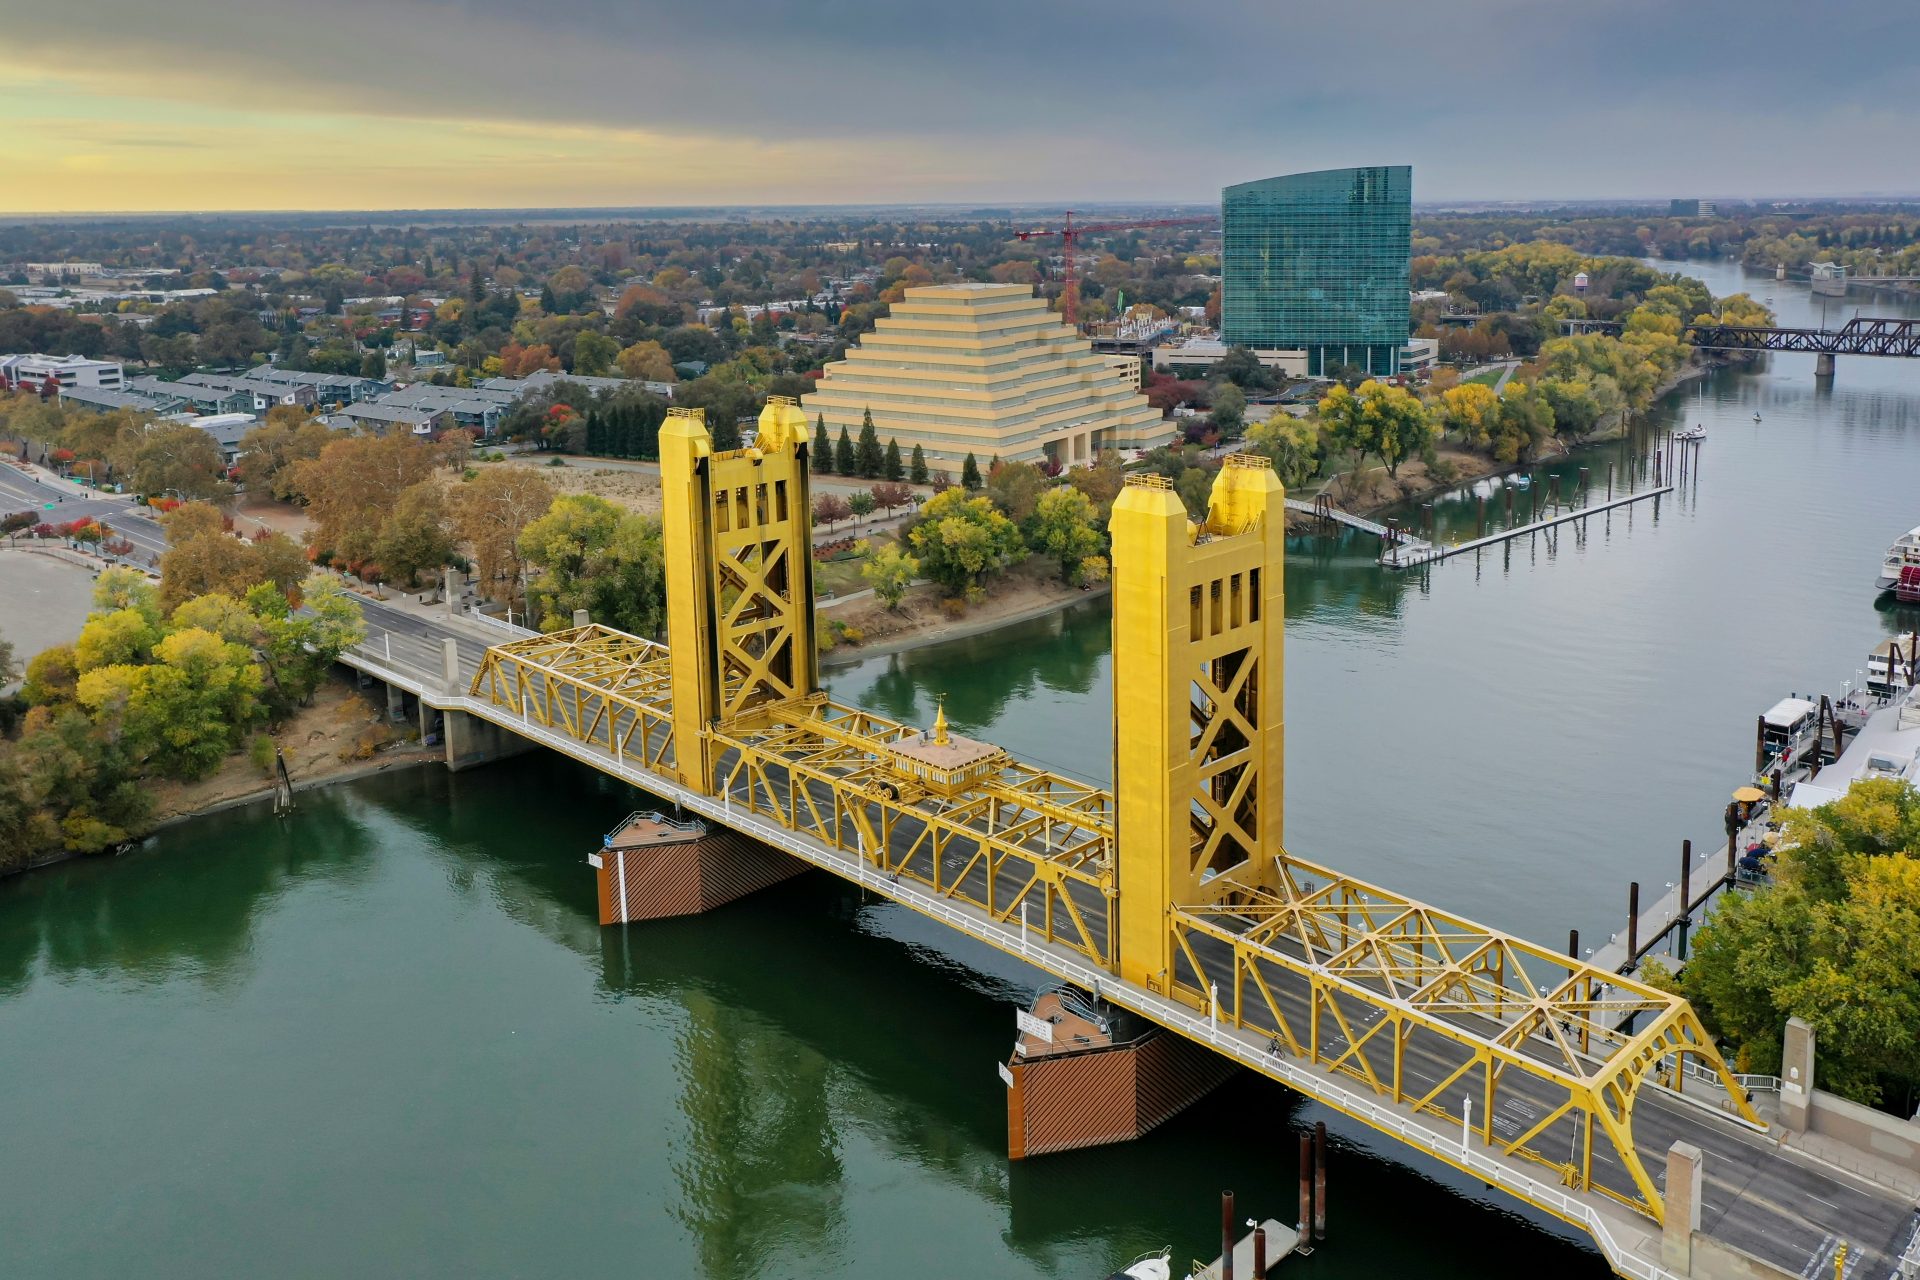
7. Sacramento, CA
Annual average concentration, 2020-2022: 13.8 µg/m³
Photo by Leo_Visions on Unsplash
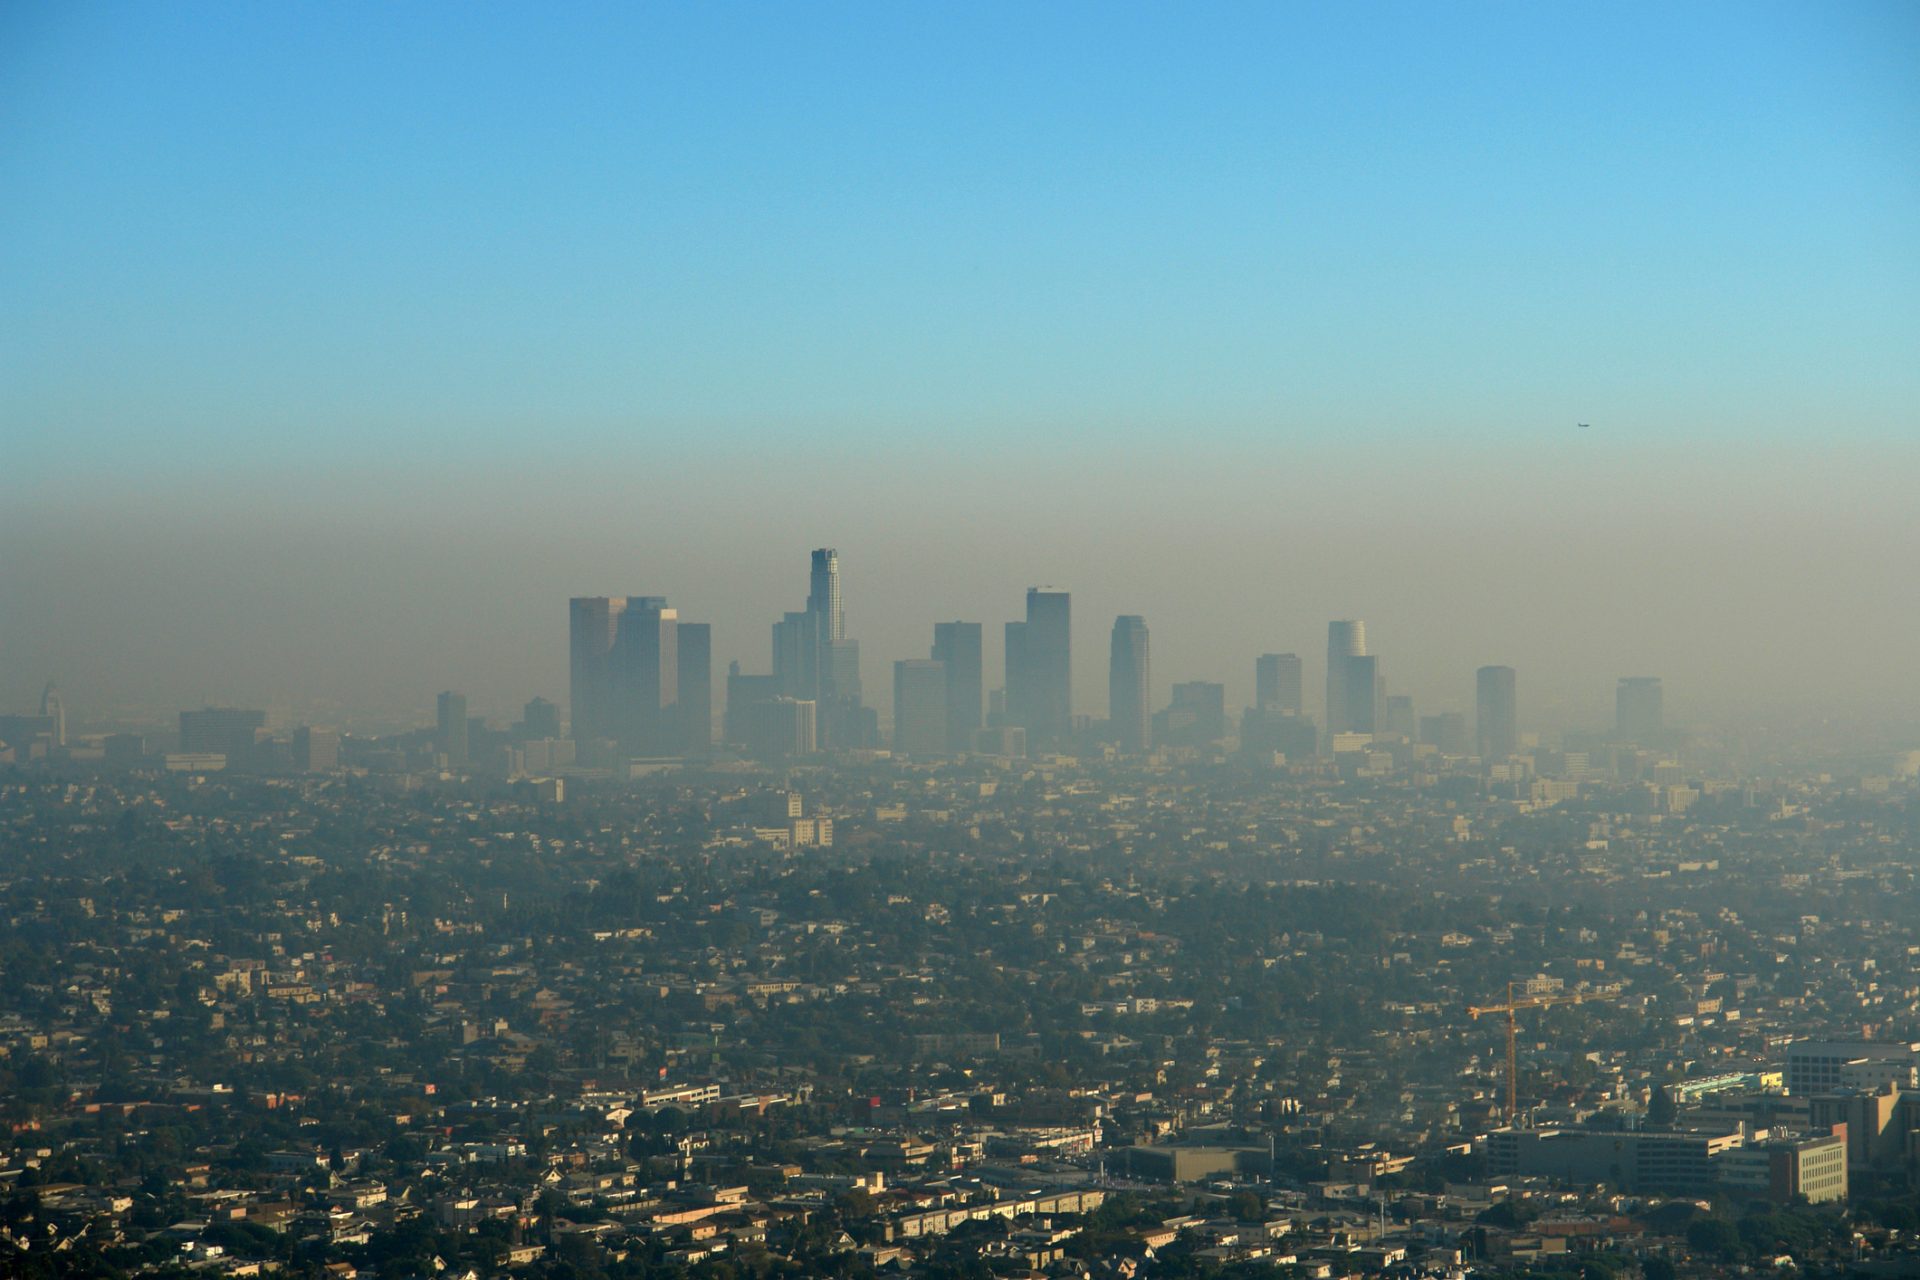
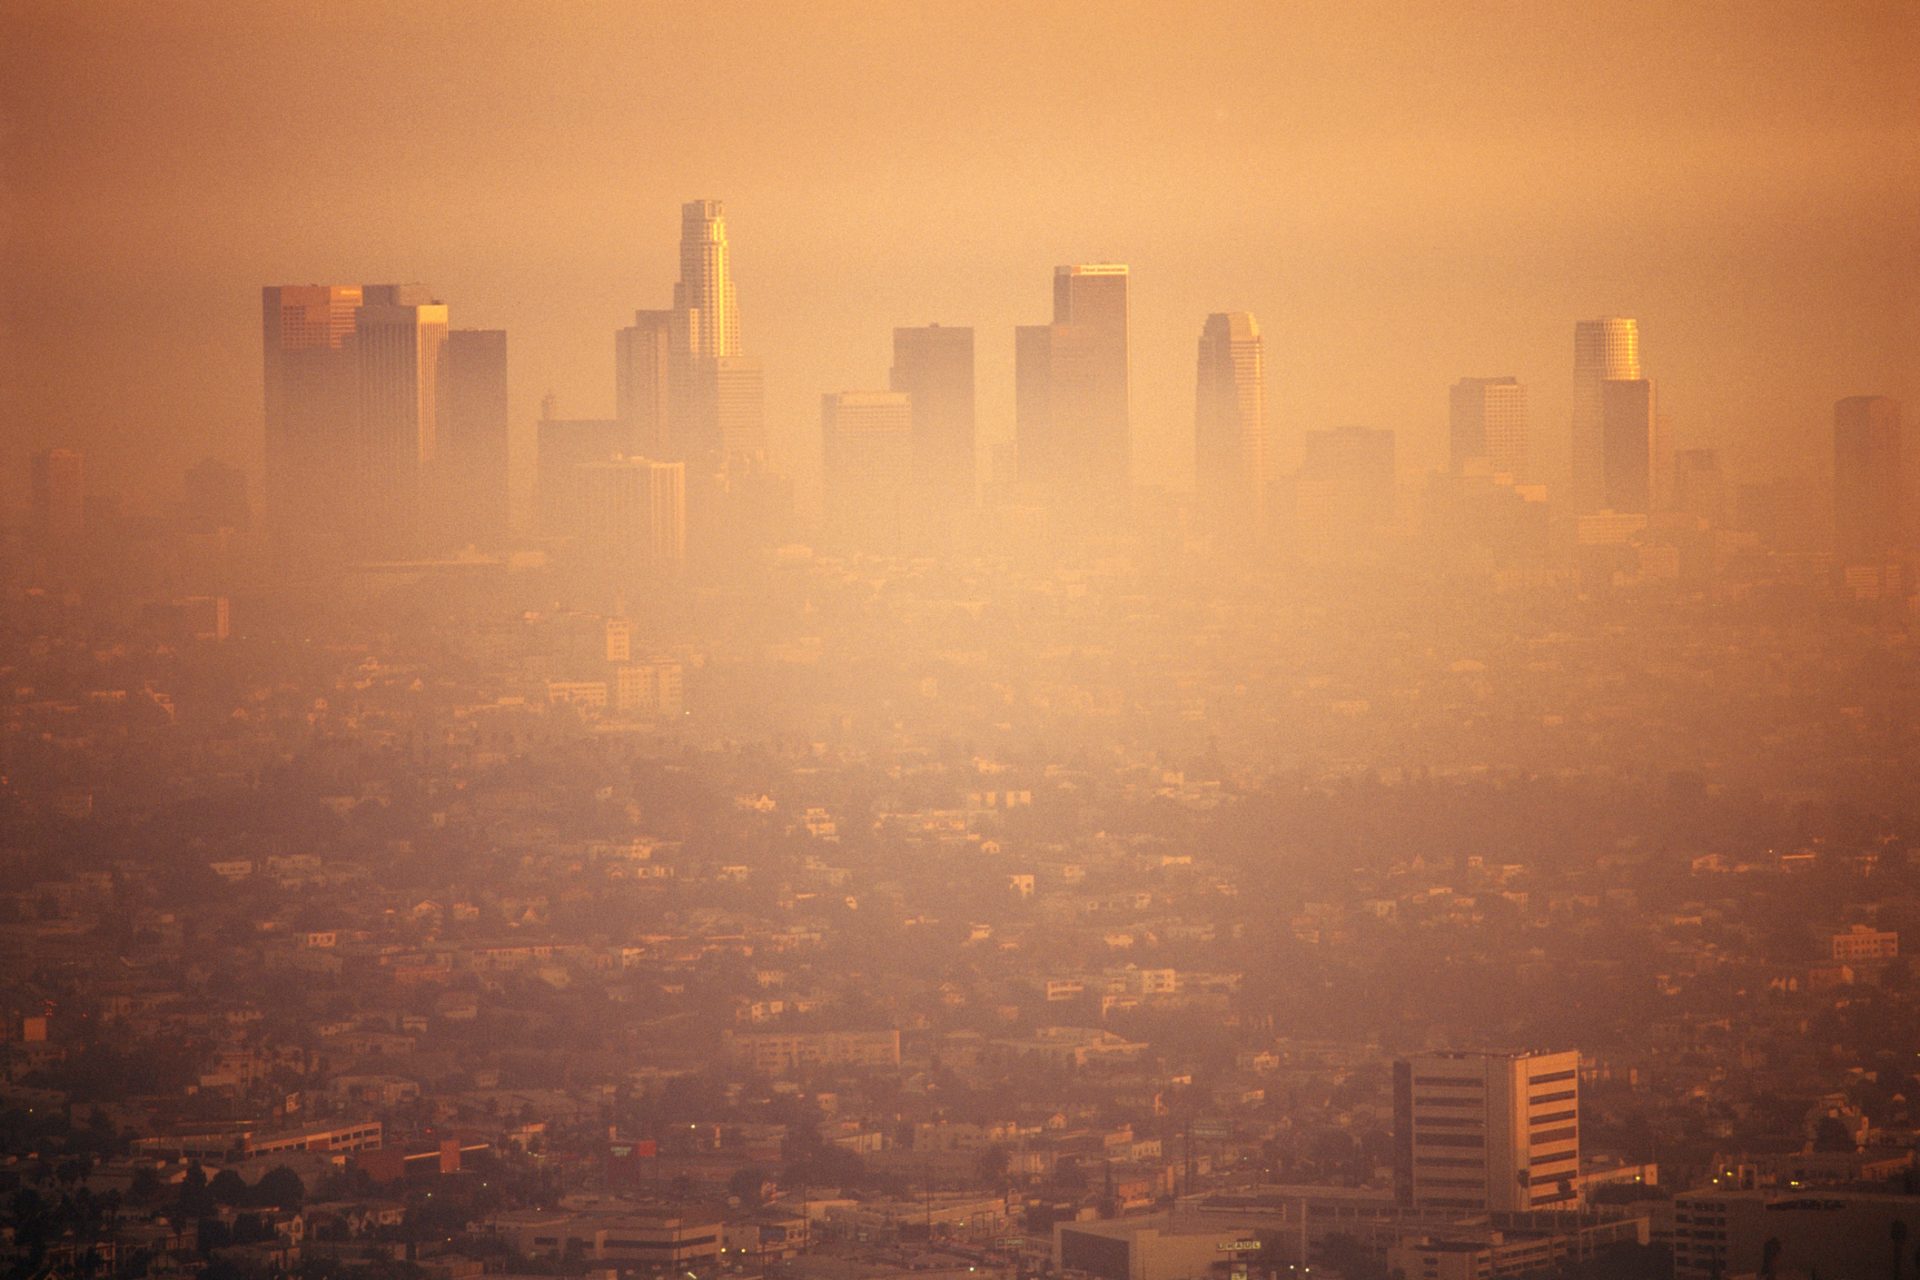
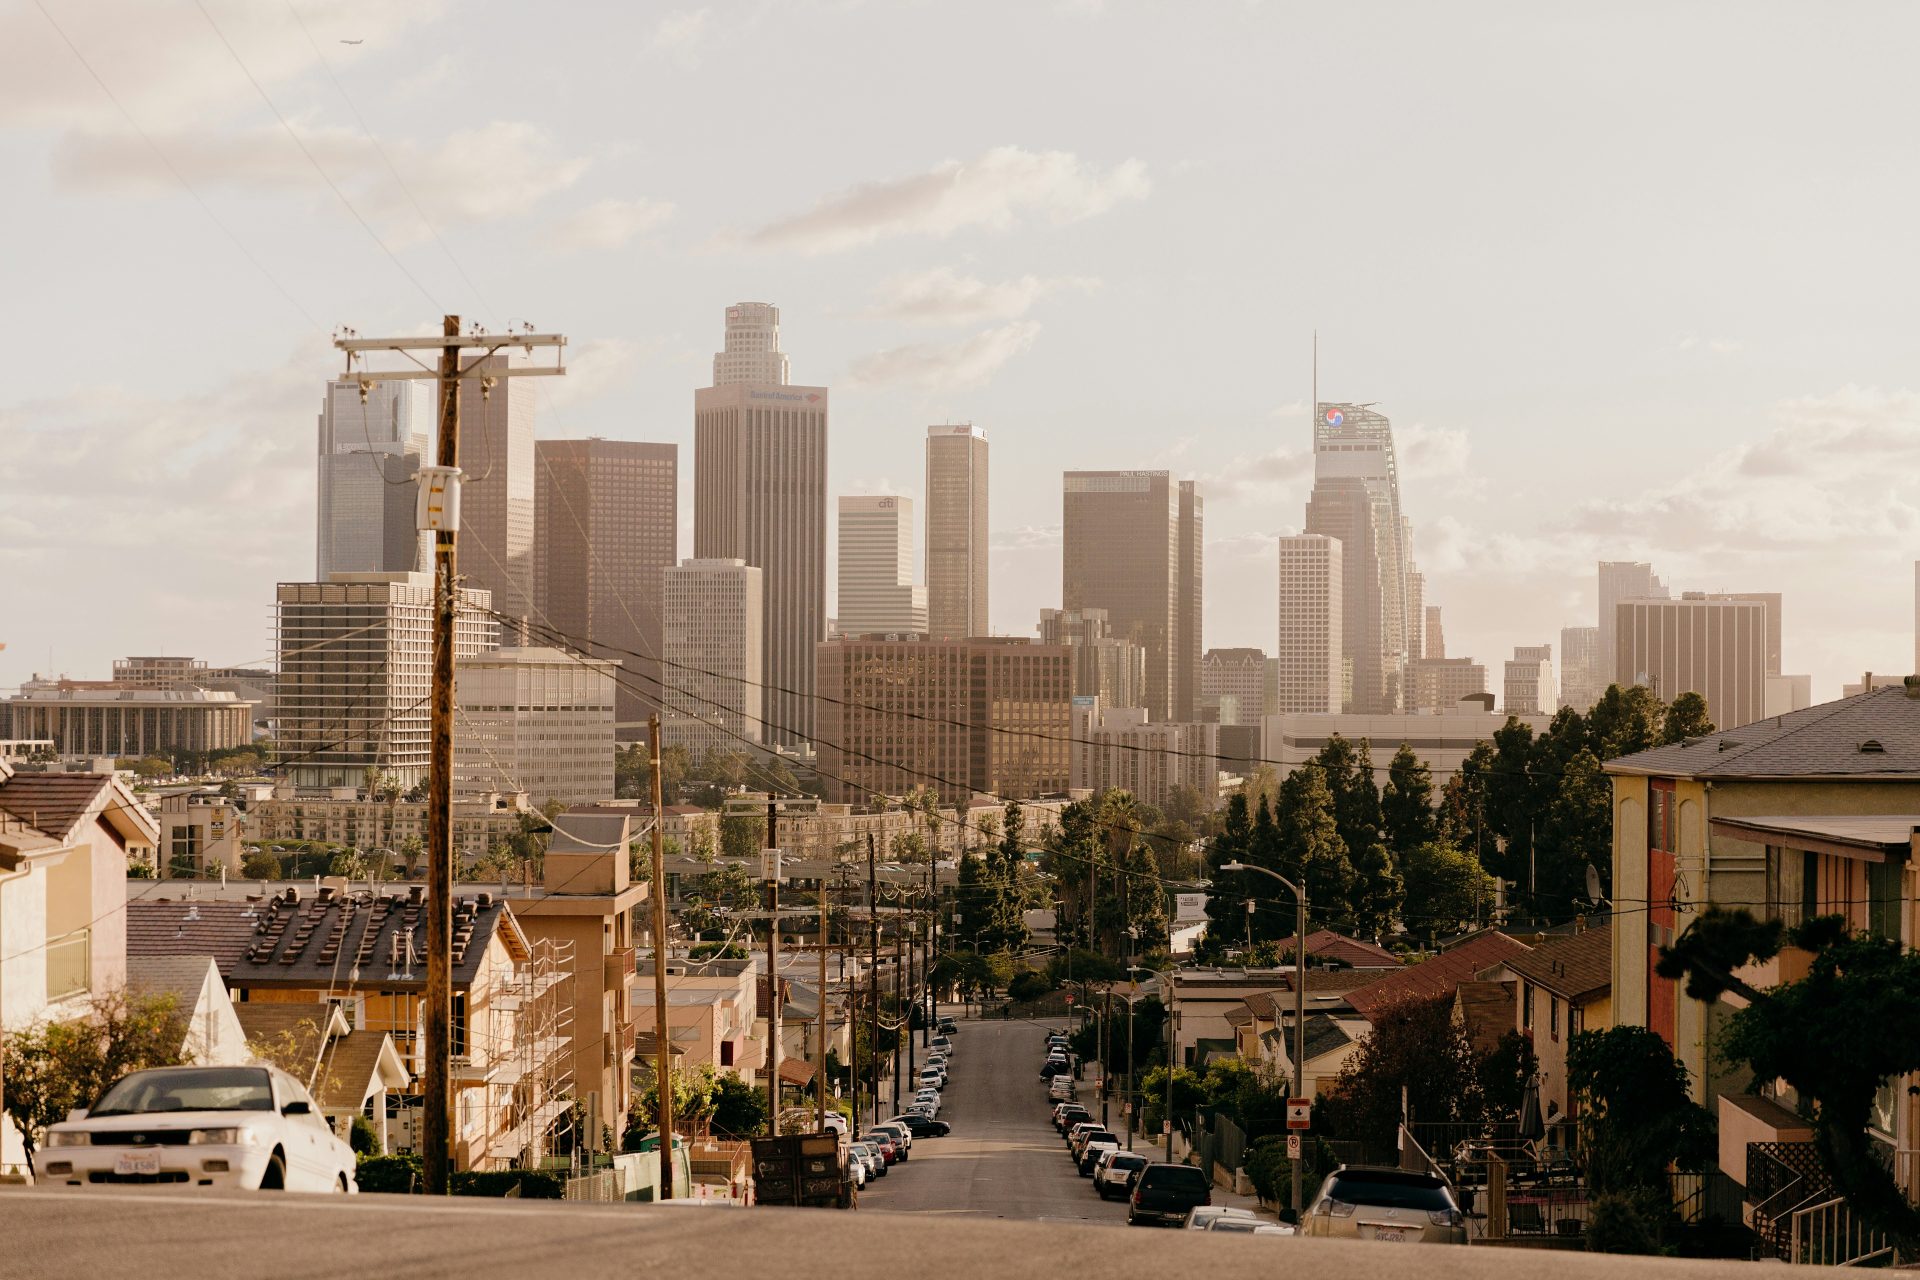
6. Los Angeles, CA
Annual average concentration, 2020-2022: 14.0 µg/m³
Photo by Dillon Shook on Unsplash
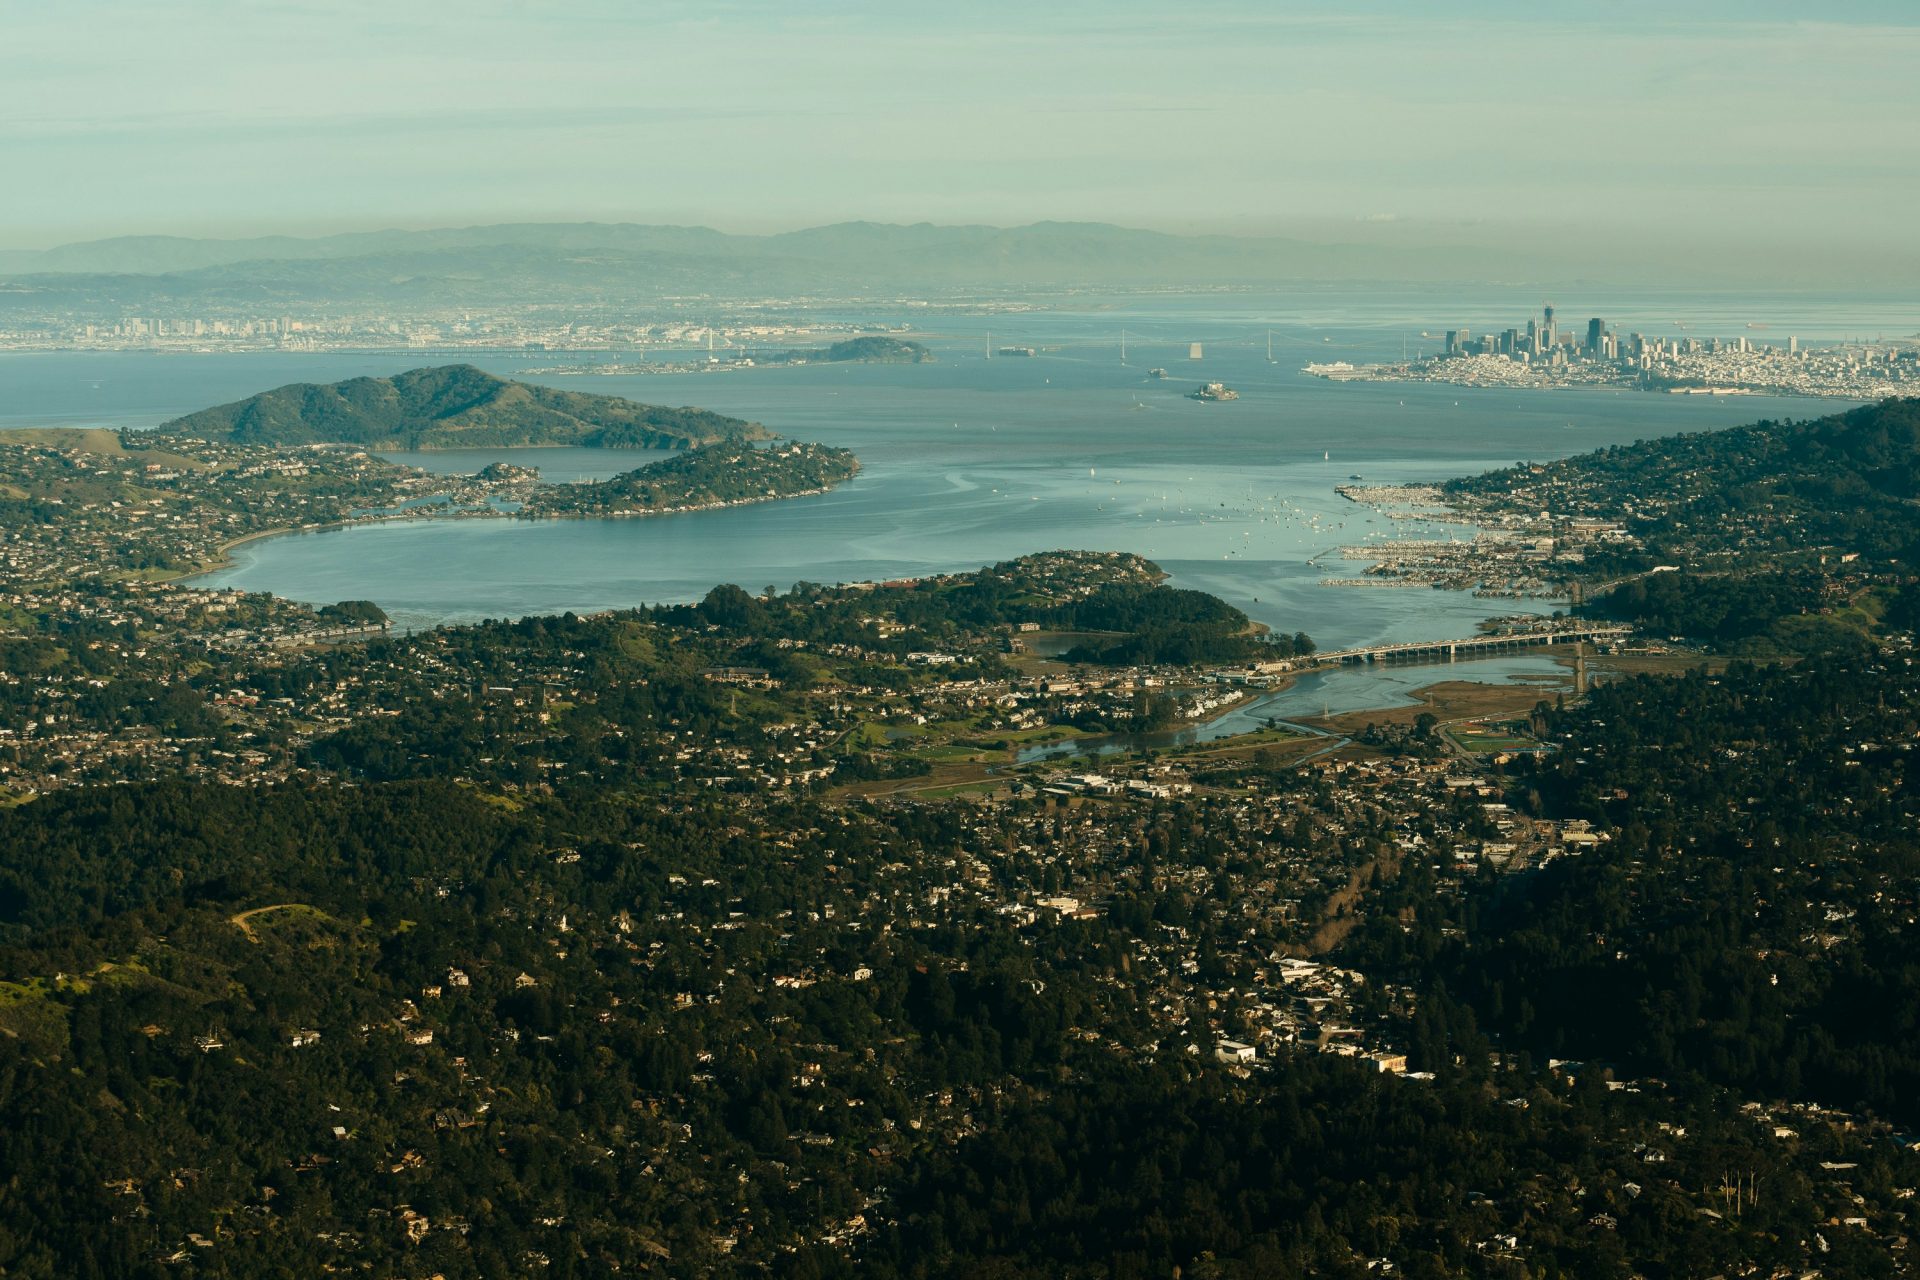
5. Bay Area, CA
Annual average concentration, 2020-2022: 14.3 µg/m³
Photo by Cedric Letsch on Unsplash
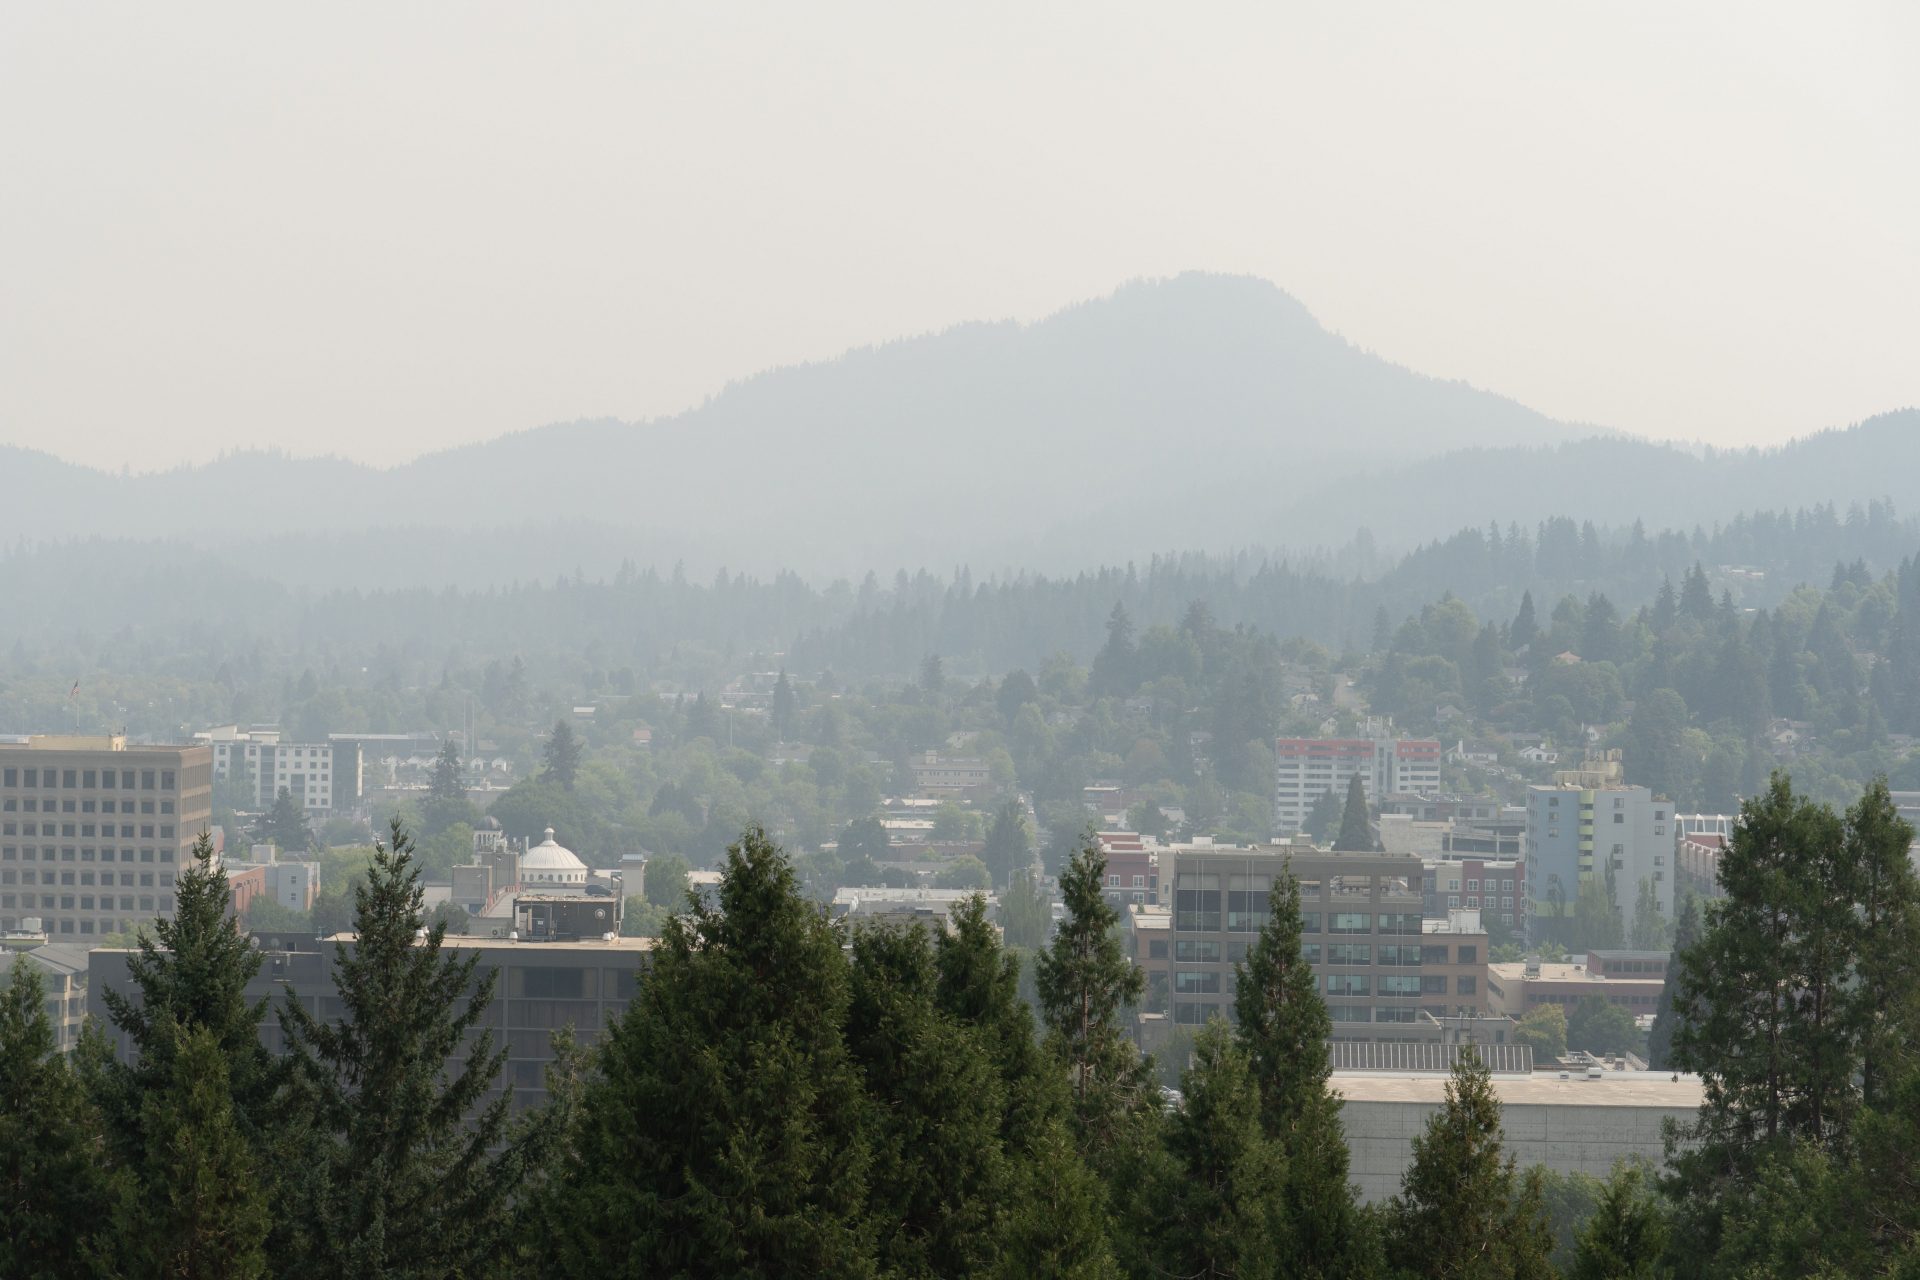
4. Eugene, OR
Annual average concentration, 2020-2022: 14.7 µg/m³
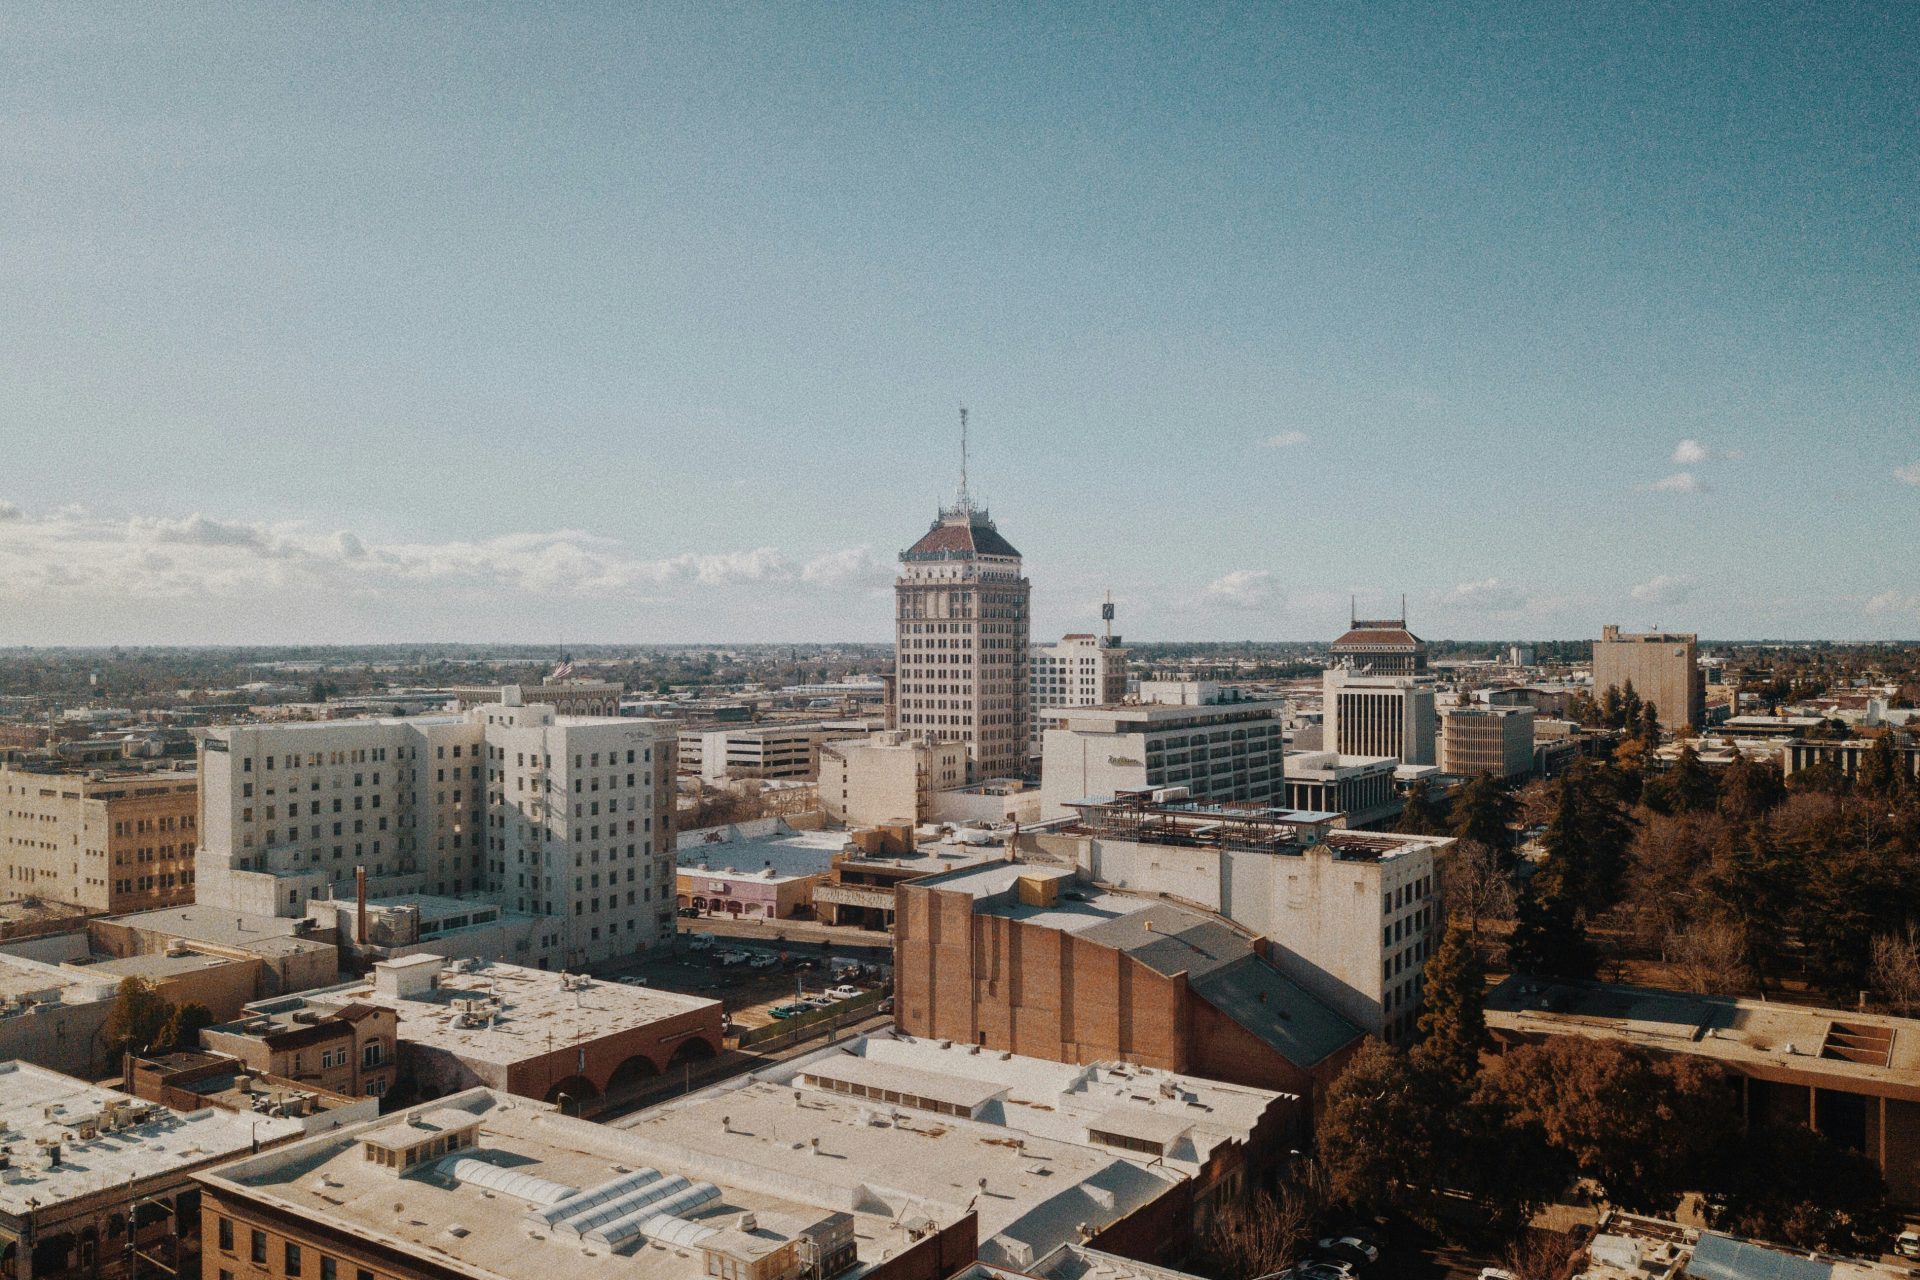
3. Fresno, CA
Annual average concentration, 2020-2022: 17.5 µg/m³
Photo by Grant Porter on Unsplash
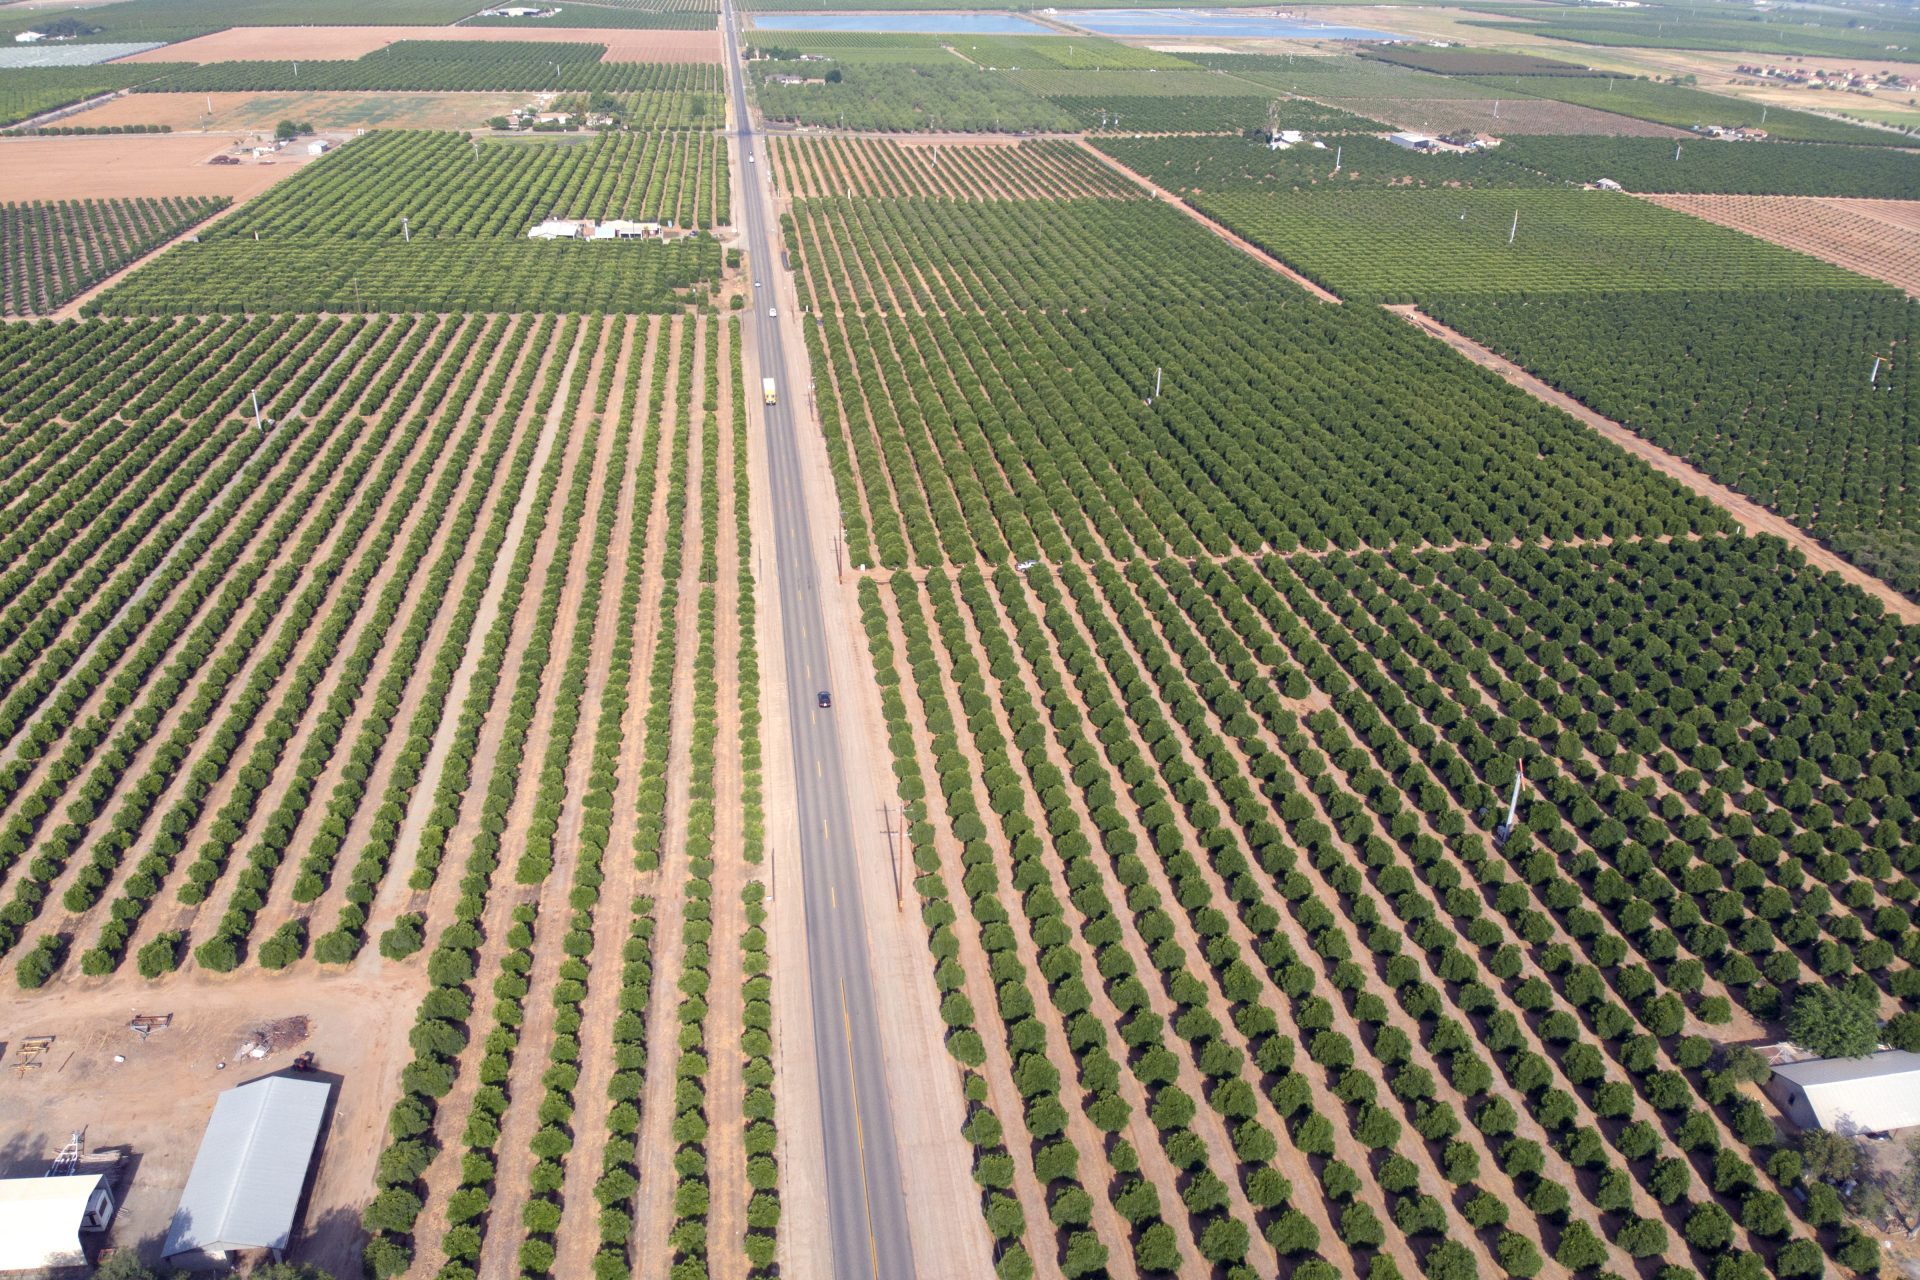
2. Visalia, CA
Annual average concentration, 2020-2022: 18.4 µg/m³
1. Bakersfield, CA
Annual average concentration, 2020-2022: 18.8 µg/m³
More for you


Science and health
Have you heard about this alarming phenomena emerging in Antarctica?
15 june, 2024
Top Stories
1
2
3
4
Science and health
Have you heard about this alarming phenomena emerging in Antarctica?
15 june, 2024
5


World
Stunning footage reveals an M2 Bradley going head-to-head with a Russian vehicle
14 june, 2024